
GainFrame is at $1,096.79 MRR this morning (verified on RevenueCat), and my last few posts have been about things that went well — the trial conversion fix, the organic traffic run, the $1,000 milestone. This one is about the problem that has not gone well. Retention is the hardest thing I've worked on in six months of building this app, and I want to write it down while it's still unsolved, because the mid-problem version is the one I never find when I search for other people's retention posts.
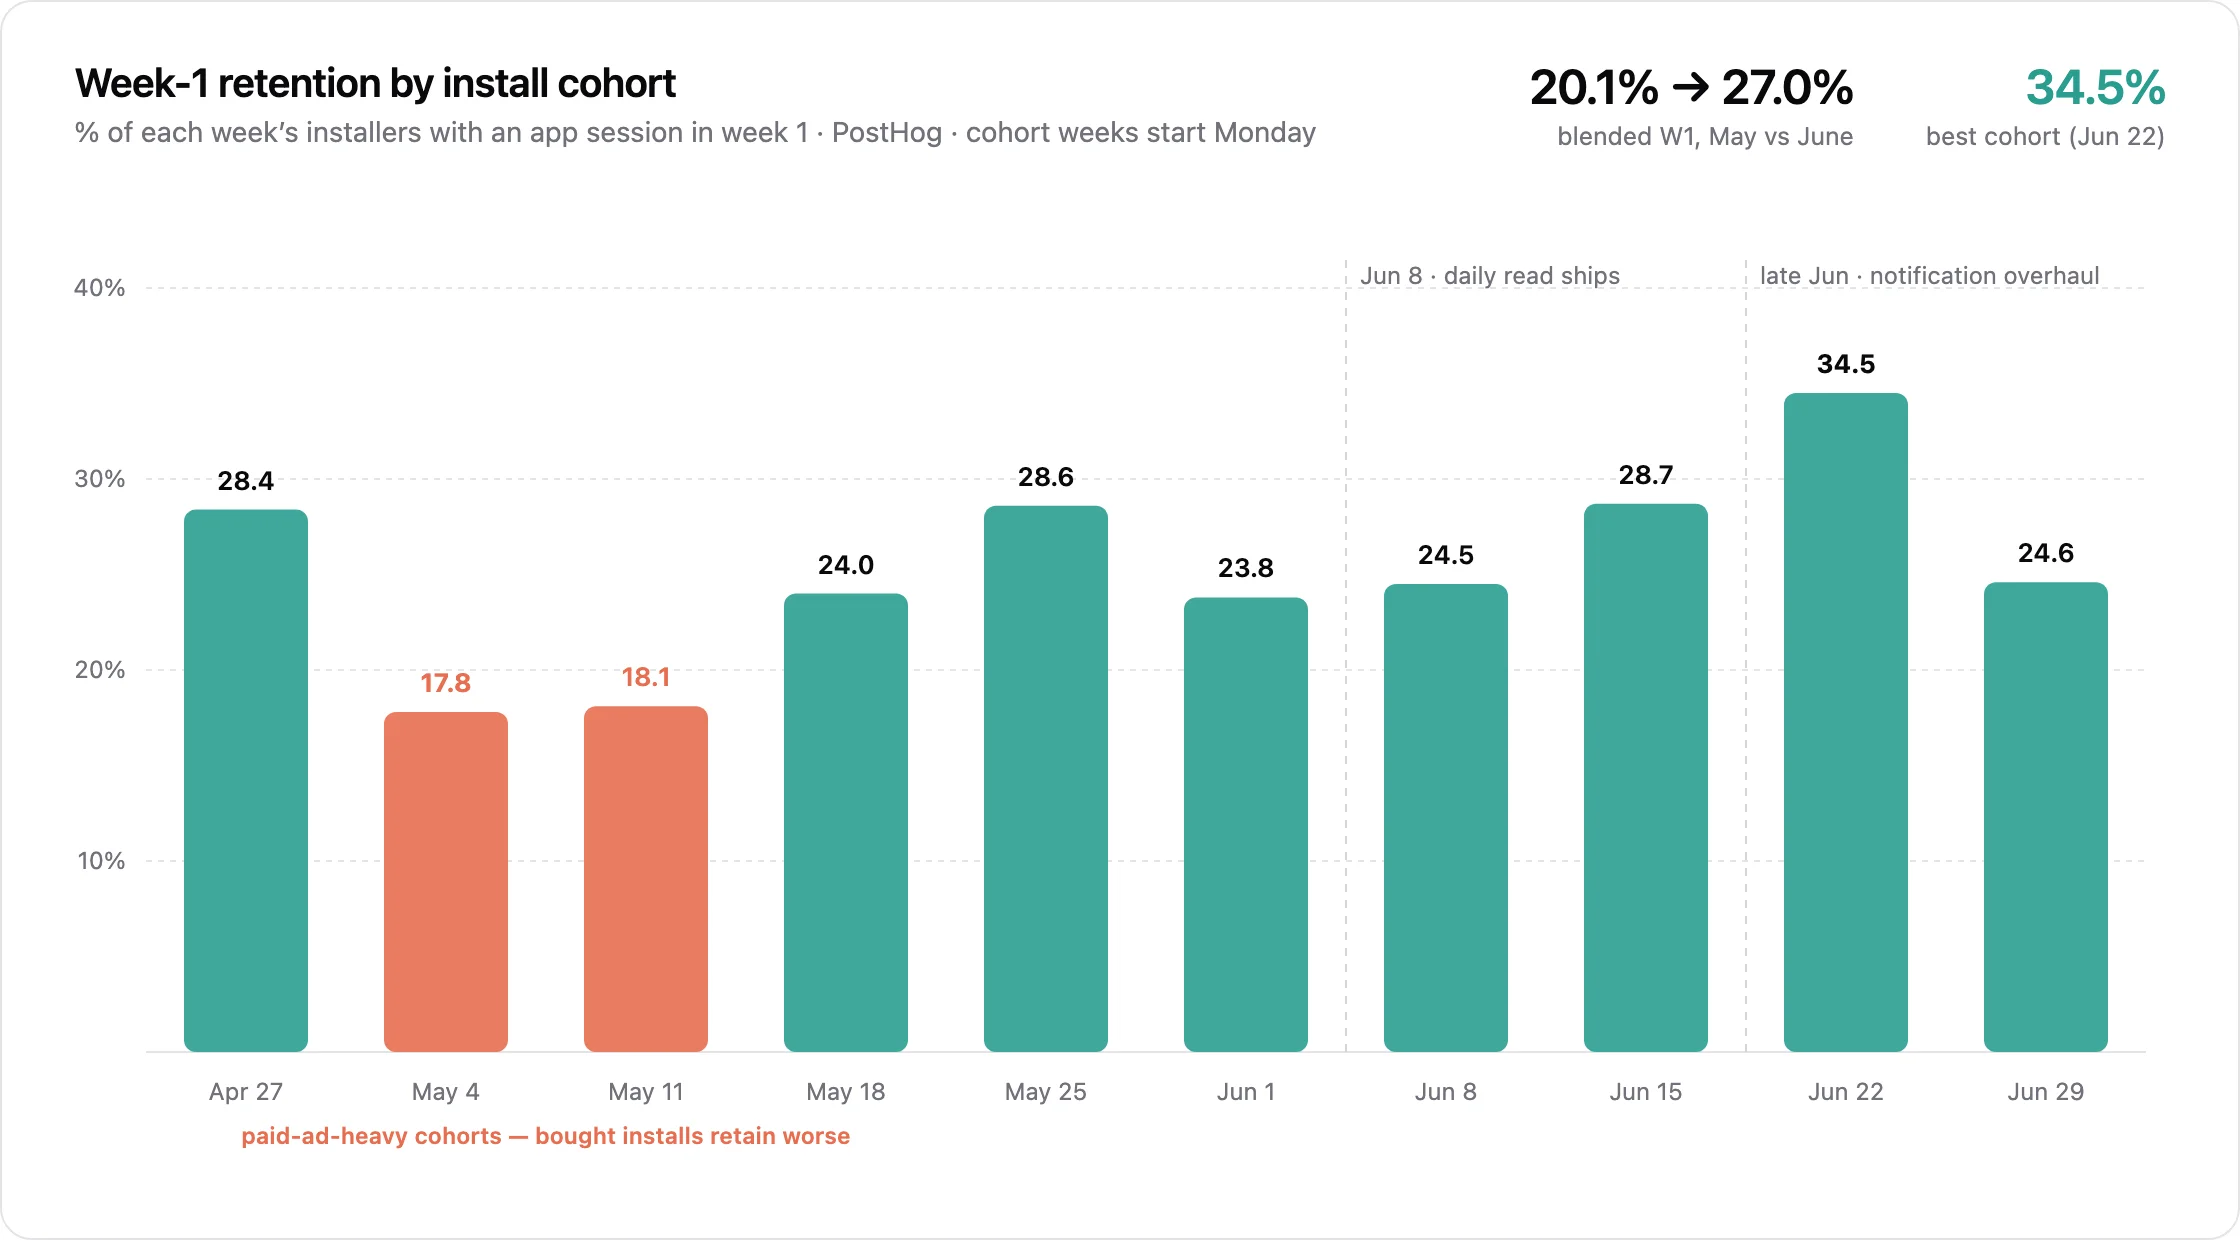
The numbers first. In June, 27.0% of the people who installed GainFrame came back at some point during their first week. That's the improved figure — it was 20.1% across May's cohorts. I spent six weeks shipping features aimed almost entirely at this, the number moved seven points, and the plain reading is still: three out of four people who install my app leave and never return.
Week 4 is worse. Somewhere between 8% and 12% of any install cohort is still active four weeks in, and that band has not moved all spring, no matter what I shipped.
The App Gets Good on Check-In Five. Most People Leave After One.
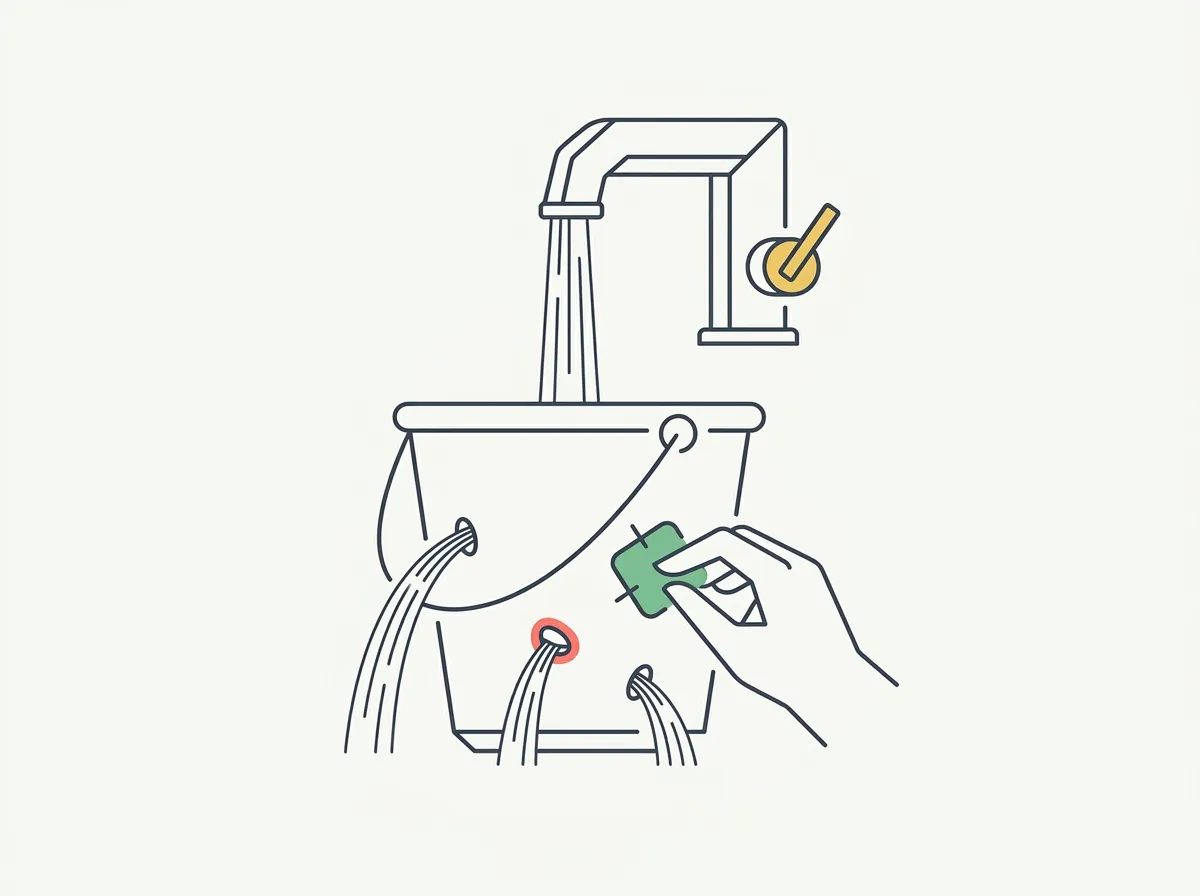
The reason this is hard, at least for my app, is structural. GainFrame's whole value is longitudinal. You check in with a progress photo, and the analysis gets richer with every check-in you feed it: after a few weeks it can tell you whether a weight jump is water or real, compare this month's photos against your own history instead of a generic chart, and give the coach enough context to say something specific about you. That's the product people pay for and keep.
A user on day two has none of that. They get one photo, one score, one narrative. It's decent, but the thing that makes people stay — watching their own data compound into insight — literally does not exist yet on day two, because there's no data to compound.
So I'm stuck in a loop I haven't cracked: users need to keep coming back for the app to become worth coming back to. Every feature I shipped in June is some attempt at bridging that gap — giving someone a reason to open the app on day 2 and day 3 that doesn't depend on having weeks of history yet. I'm still tweaking this and I have not figured it out. Some of what follows helped. None of it solved it.
The Cohort Table
Installers by week, and the share with an app session in weeks 1, 2, and 4. Cohort weeks start Monday; data from PostHog with test accounts filtered.
| Install cohort (wk of) | Installs | W1 retained | W1 % | W2 % | W4 % |
|---|---|---|---|---|---|
| Apr 27 | 204 | 58 | 28.4% | 17.2% | 11.8% |
| May 4 | 348 | 62 | 17.8% | 8.9% | 7.8% |
| May 11 | 309 | 56 | 18.1% | 12.6% | 8.4% |
| May 18 | 125 | 30 | 24.0% | 19.2% | 11.2% |
| May 25 | 105 | 30 | 28.6% | 21.9% | 12.4% |
| Jun 1 | 160 | 38 | 23.8% | 16.3% | 9.4% |
| Jun 8 | 200 | 49 | 24.5% | 14.0% | 8.5% |
| Jun 15 | 178 | 51 | 28.7% | 18.5% | 8.4% |
| Jun 22 | 200 | 69 | 34.5% | 19.5% | — |
| Jun 29 | 301 | 74 | 24.6% | 10.6%* | — |
* The Jun 22 and Jun 29 cohorts haven't existed long enough for mature W2/W4 numbers — the starred figure will still rise. I've excluded the Jul 6 cohort entirely; its measurement window was four days old at pull time and the number it shows is an undercount.
Blended: May 4–25 cohorts (887 installs) came back in week 1 at 20.1%. June's cohorts (1,039 installs) at 27.0%. For context, the industry benchmarks I've seen put typical health & fitness week-1 retention in the high teens to mid-20s, so I started this push at roughly benchmark and June is somewhat above it. That sounds better than it feels to work on.
What I Shipped in the Six Weeks
Everything here is aimed at the same target: a reason to open the app on a day you didn't take a photo.
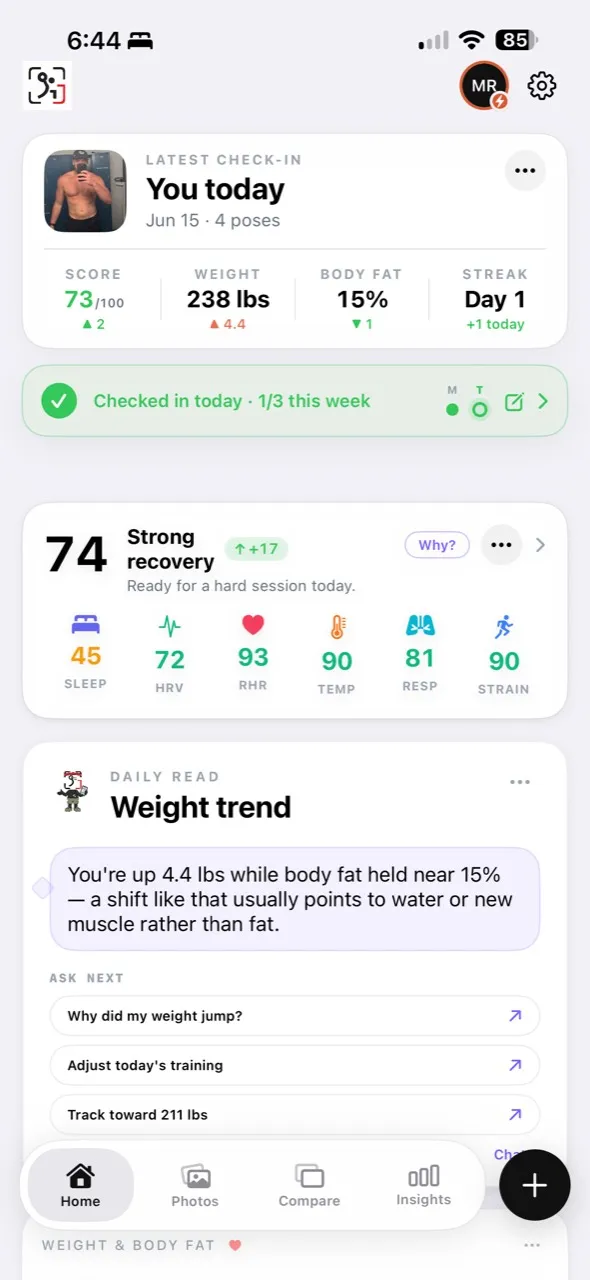
The daily read and day verdicts (week of Jun 8). A short daily note on the dashboard, built from your recent data — weight trend, recovery, what changed — with follow-up questions that drop you into the coach. The point is that it works even on non-photo days, which is exactly where new users fall off. It was shown 248 times in its first week. By the week of June 29 it was 2,407 times a week, and the day-verdict cards that shipped alongside it went from zero to 1,673 a week. This is the biggest single correlate of the week-1 lift, with a correlation caveat coming below.
The capture banner redesign (Jun 11). The home screen used to have a generic take-a-photo button. Now there's a docked "today" slot with a weekday strip that shows your week at a glance — what's logged, what's missing, what today needs. Small change, but it makes day 2 look like a continuation of day 1 instead of a blank screen.
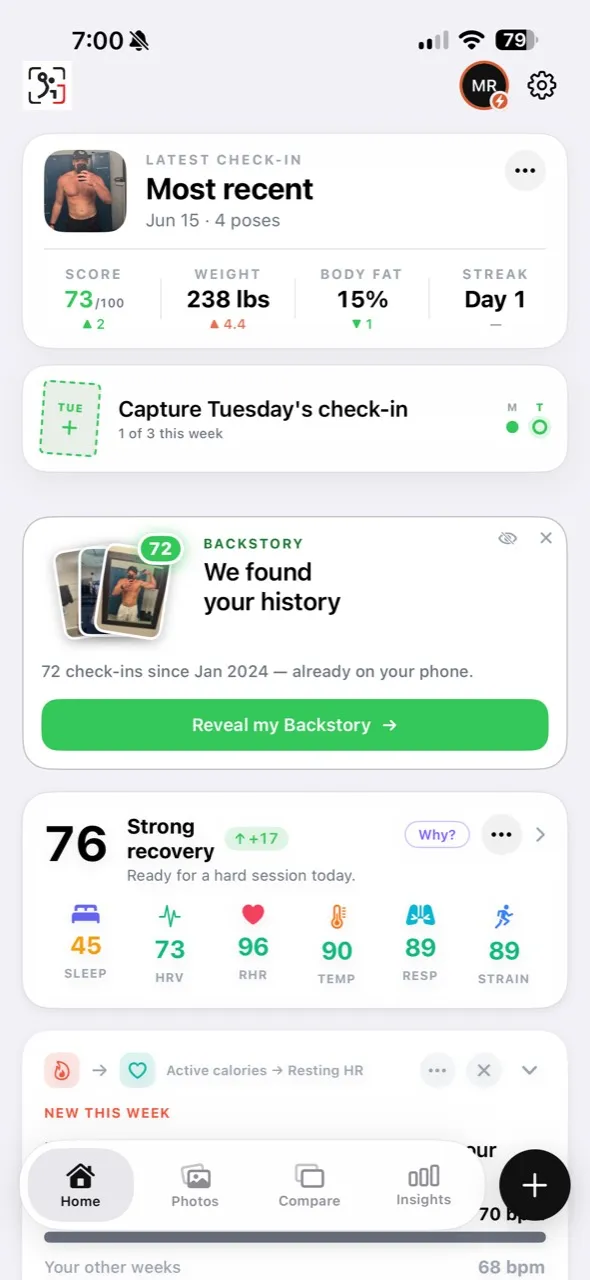
The notification overhaul (v2.19, late June). I audited every notification the app sends and rebuilt the set around insights — the coach telling you something it noticed in your data, or a rescue prompt scheduled for when a week is about to end with zero photos. The old set was mostly check-in reminders, which I suspect read as nagging, and a nag is a reason to uninstall.
The coach became a habit surface on its own. Weekly coach users went from 29–33 in May to 86–101 in July, check-in taps from 229–265 a week to 330–393, and generated weekly summaries from 1,062 a week in late May to 2,364 by the week of June 29. I covered the cost side of that growth in the AI margin post.
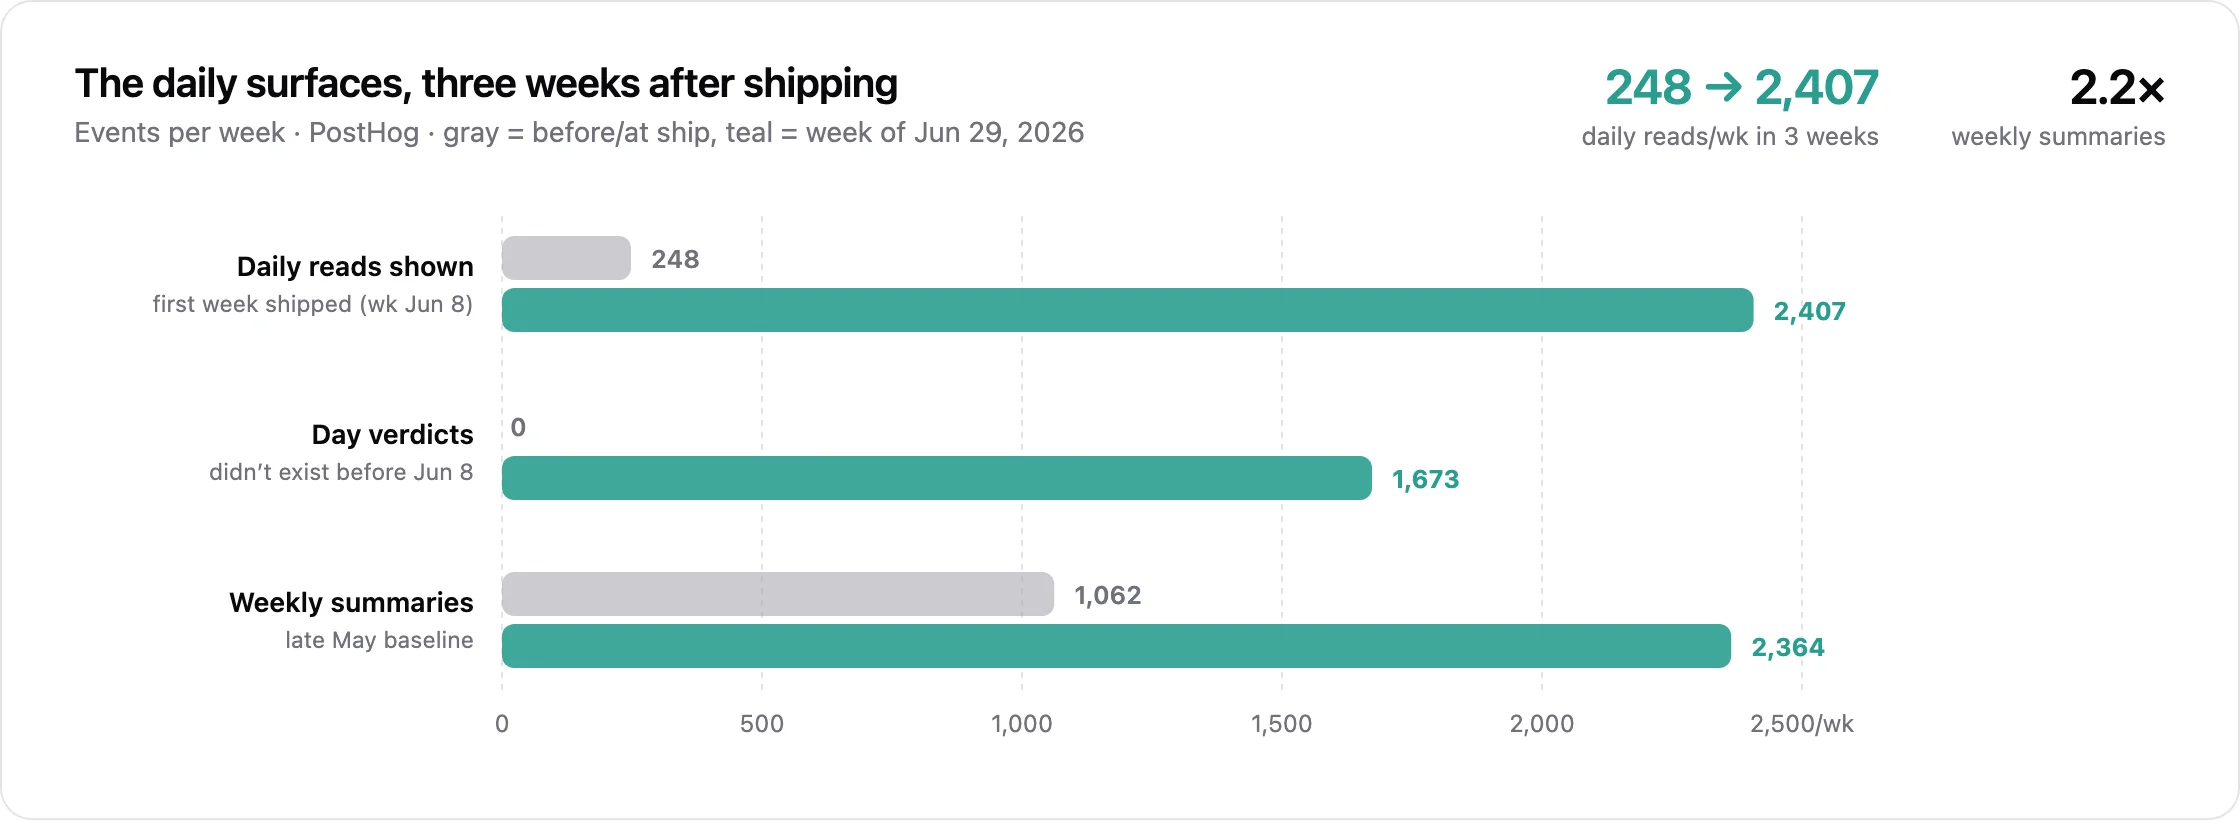
Overall weekly actives went from 281 the week of May 25 to 593 the week of July 6, so the app is unambiguously more used. Whether it's more retaining is the murkier question the caveats below are about.
The Caveats
There are five of them, and the first one cuts the headline number down a lot.
Part of the improvement is traffic mix, and I have to say that out loud. The two floor cohorts — 17.8% and 18.1% in early May — landed during my paid ads experiment, and bought installs retain worse: paid cohorts ran 17–21% week-1 against 27–30% for organic. Comparing organic to organic, mid-to-late May was around 24–29% and June ran 25–35%. So the claim I can defend is a 5–8 point organic lift with the best cohort at 34.5%, and the 18-to-34 spread you'd read off the chart overstates it.
Week 4 hasn't moved. Every cohort mature enough to measure lands between 7.8% and 12.4%, before and after all of the above. The June ships show up at week 1 and week 2; whether they bend week 4 is unknowable for a few more weeks because those cohorts are still young. This is the number that decides whether any of this mattered, and I don't have it yet. I'll report back either way.
Cohorts bounce. The 34.5% cohort was followed immediately by a 24.6% one — that later cohort was 50% bigger with a heavier share of installs from my web traffic. One great bar is a range, and treating it as the new baseline would be lying to myself with a chart.
I can't prove causation on any of it. Nothing here was A/B tested against a holdout. People who use the coach retain dramatically better — 58–81% week-1 — but that's selection, motivated users open the coach, and claiming the coach causes retention from that number would be exactly backwards.
The better my blog does, the worse this metric will look. A growing share of installs now comes from organic search content, and content-driven installs are lower intent than someone who searched the App Store for a progress photo app. The Jun 29 dip is probably this arriving early. It's a trade I'll take, but it means the W1 line can go down while the business gets better, which makes this whole dashboard fun to interpret.
What I'm Trying Now
The thesis behind all of it: the reward for coming back should be richer analysis, and it should get visibly richer with every check-in. Each day you log, the daily read gets more specific because it has more of your history to draw on — that's the loop I'm trying to make obvious inside the first week, so a new user can feel the compounding before they'd otherwise churn. I'm still tweaking how fast that payoff shows up and how loudly the app points at it.
Alongside that: the notification timing and content work continues, I'm adjusting the streak and check-in mechanics, and a churn-rescue lane shipped July 14 in v2.22 — a flow that catches people who look like they're about to lapse. It's two days old and has zero data, so it goes in the "what's next" bucket rather than the results section.
Where That Leaves It
$1,096 in MRR. Conversion fixed. Traffic growing. And a week-1 retention line that moved seven blended points after six weeks of work aimed directly at it, on a week-4 line that hasn't moved at all.
Everything else on this project gave me a number that responded when I pushed on it. Ads were bad, so I turned them off. Conversion was broken, so I fixed the paywall. This one is different. It moves slowly, it bounces, and part of what moves it has nothing to do with the product. I'm five months in, the app is objectively more used than it's ever been, and I still lose three of every four people in the first week. If the compounding-insight loop works and week 4 ever lifts off 10%, that's a post I'd love to write. If it doesn't, I'll write that one instead.
If you've genuinely moved week-4 retention on a consumer health or fitness app, I want to hear what did it — comments or DMs, and I'll trade every number I have.
Track your progress with GainFrame
Take or import a gym photo and get an AI body fat estimate, physique score, FFMI, and muscle breakdown, plus a Coach that explains what changed using your photos, weight, and workouts.
Download GainFrame Free