
My app's website is getting around 1,500 clicks a day from Google on the latest two days of complete data. Free tools brought in nearly half the search traffic in my latest audit. RevenueCat shows $2,354.65 MRR and $14,816.20 total revenue since March this morning.
So, nearly $2,400 MRR and $15,000 in revenue. Still a small app, but a lot further along than when I was paying to get people to notice it.
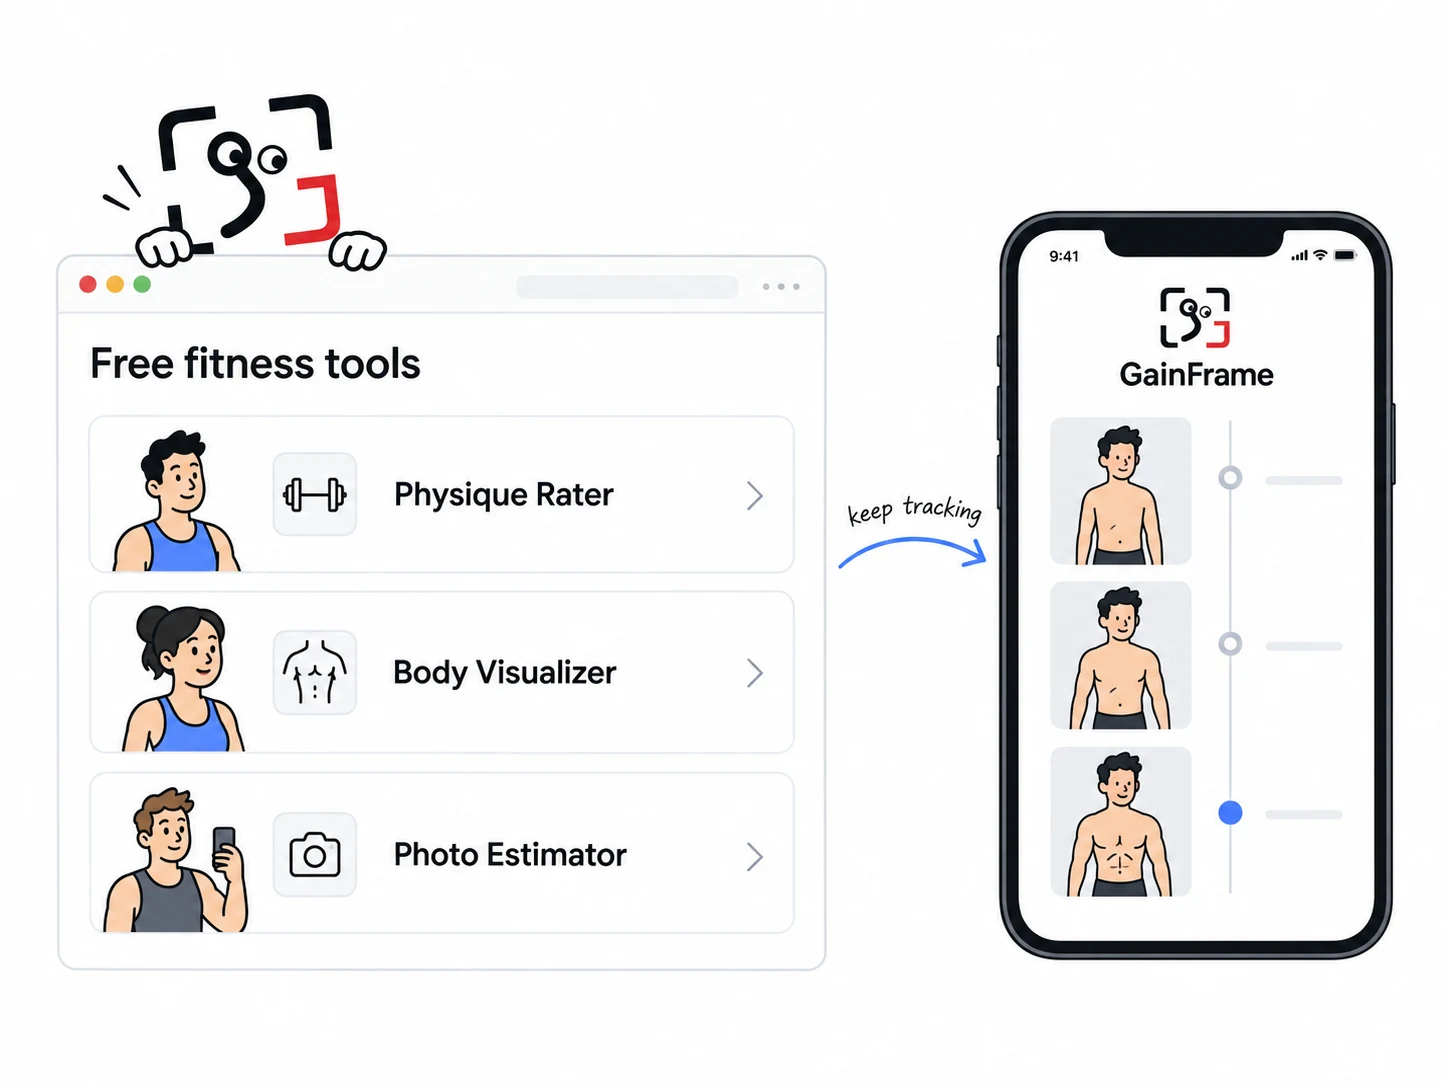
I build GainFrame, an iPhone app for tracking gym progress through photos. The website lets people try related things for free: estimate body fat from a photo, get a physique score, or explore a body visualizer. Someone can get a result before deciding whether they want an app to track changes over time.
I think the tools are helping the business grow. I still don't know how much of the revenue came from them because I can't reliably connect a website visitor to a paid subscription. I can now see more people clicking through from the tools to the App Store, which is a useful step forward from my August update.
How much has Google search traffic grown?
Google Search Console recorded 1,477 clicks on September 12 and 1,598 on September 13. The average for September 7–13 was 1,308 clicks a day, so 1,500 describes the latest couple of days. I haven't held that average for a full week yet.
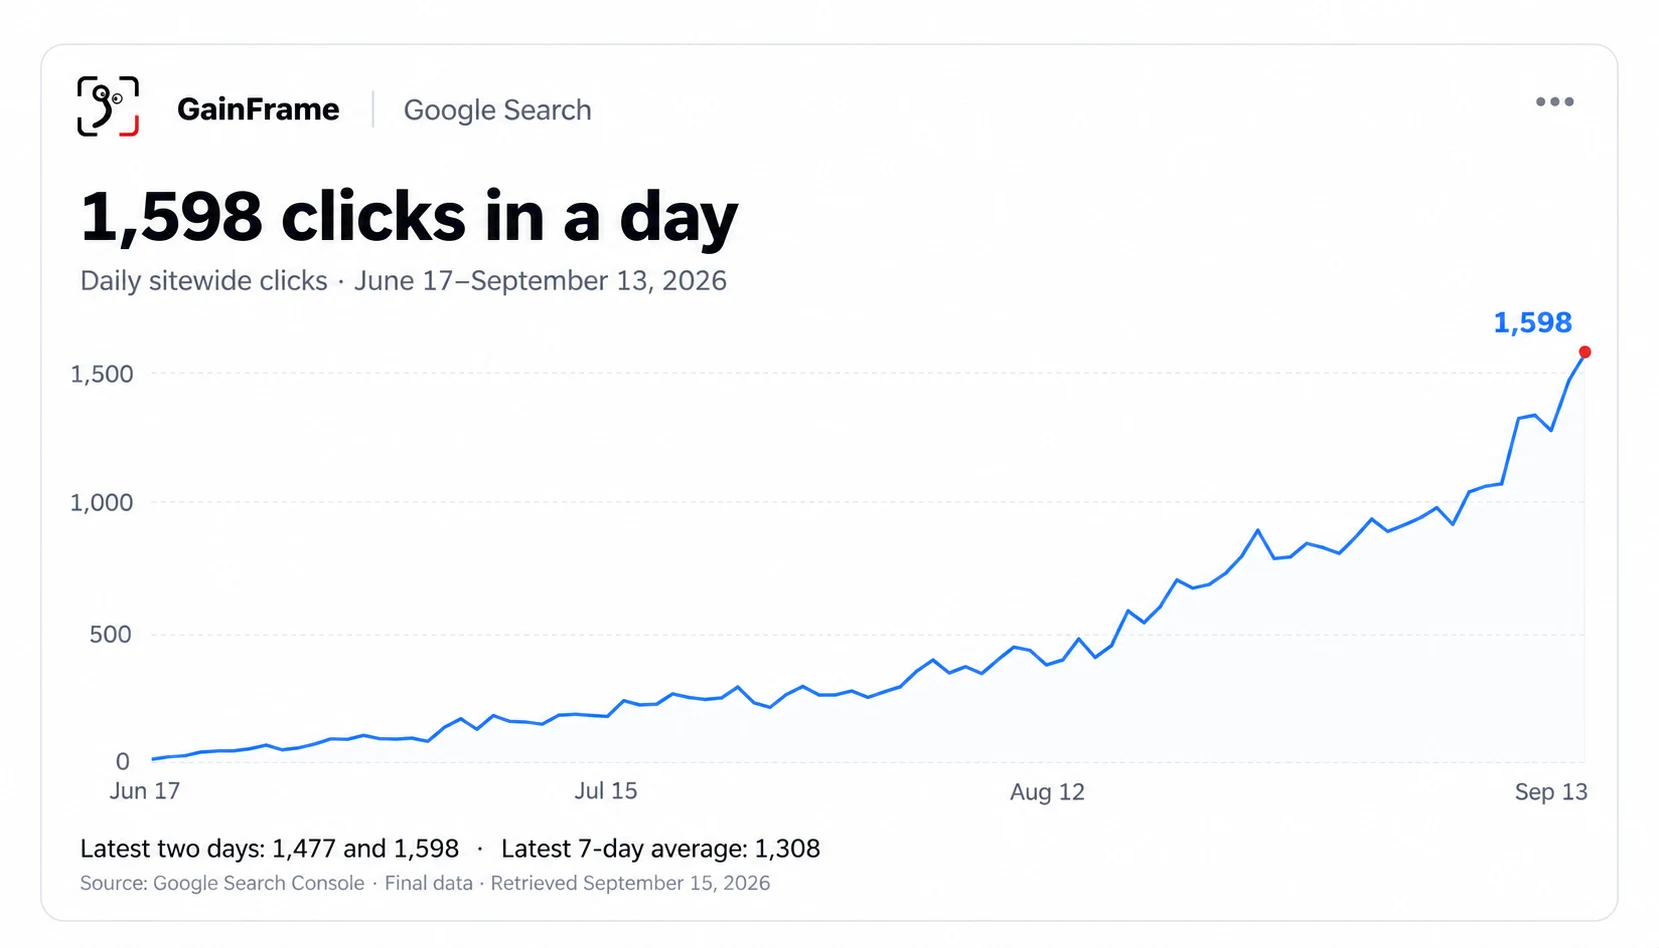
The longer view is more useful than picking the best day. Three consecutive 28-day periods looked like this:
| Period | Google clicks to the site |
|---|---|
| June 17–July 14 | 2,871 |
| July 15–August 11 | 8,340 |
| August 12–September 8 | 21,645 |
The last period had 7.5 times the clicks of the first. Blog posts still do a lot of the work: they brought in 10,581 clicks in that last period. The tools and their directory brought in 9,923, or about 46% of the site's search clicks. Page totals and Google's site total can differ slightly, so I keep that share rounded.
Which free tools are bringing people in?
The tools went from 2,757 to 9,923 Google clicks across the last two periods, an increase of 260%. Four pages accounted for 9,031 of those clicks.
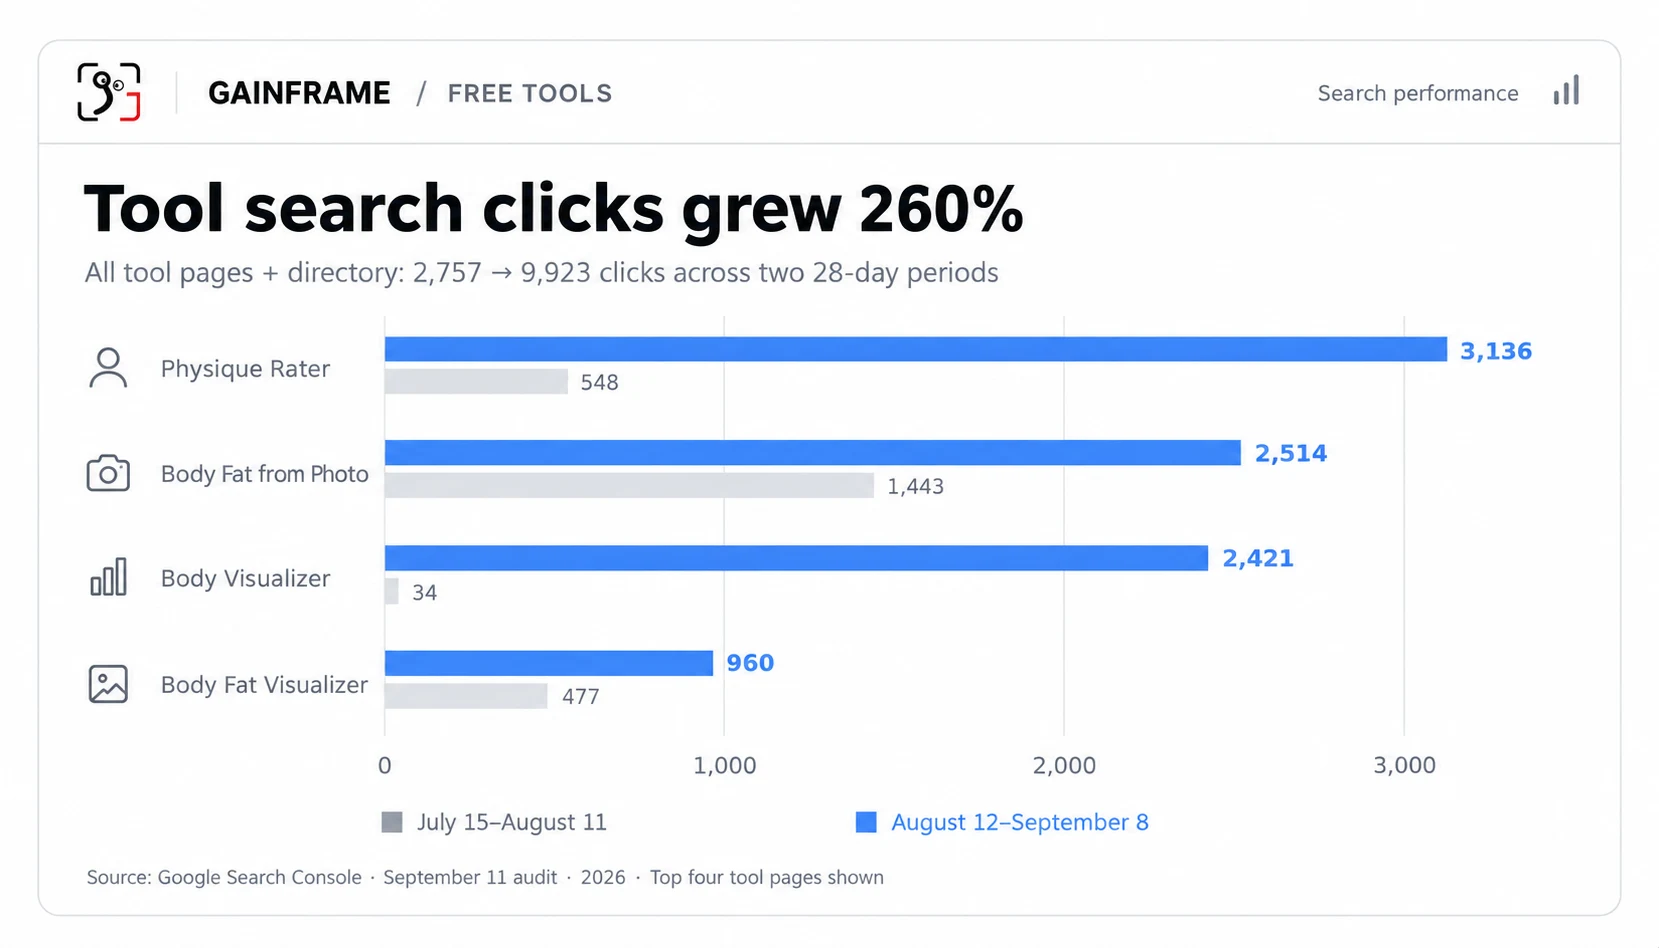
| Free tool | July 15–August 11 | August 12–September 8 |
|---|---|---|
| Physique Rater | 548 | 3,136 |
| Body Fat from Photo | 1,443 | 2,514 |
| Body Visualizer | 34 | 2,421 |
| Body Fat Visualizer | 477 | 960 |
Body Visualizer is the one I want to spend a little more time on. I shipped it on August 6 after an audit found people searching for a broader body visualizer than the body-fat reference tool I already had. In my August post, it had 33 clicks in a slightly different 30-day window and was too new to judge.
It now has 2,421 clicks in the audit's latest 28 days. The earlier 34-click comparison only includes its first six days online, so some of that jump is simply the page having time to get found. Still, a tool that barely existed a month ago is now one of the site's largest entry pages.
The distinction between the two visualizers matters. The Body Visualizer uses height and weight for a broad visual reference, or lets people compare entered measurements. The Body Fat Visualizer shows reference images across body-fat percentages. They answer different searches, and I kept them on separate pages.
The generic calculators have been much quieter. TDEE, macros, FFMI, calorie deficit, and one-rep max haven't become the main source of traffic. Having more tools in the directory hasn't automatically helped. A few specific ones are doing most of the work.
How do the free tools lead to the app?
The basic idea is to give someone a useful answer to the thing they searched for, then show them what they could keep doing in the app.
The Physique Rater is a good example. Someone searches for a physique rating, uploads a photo, and gets a score broken into body fat, muscle, proportions, and goal fit. They can try it without creating an account. The app gives them a place to keep checking in and comparing changes over time.
That connection is easier to explain after someone has seen their first result. They already know what a score means and have a reason to wonder how it might change.
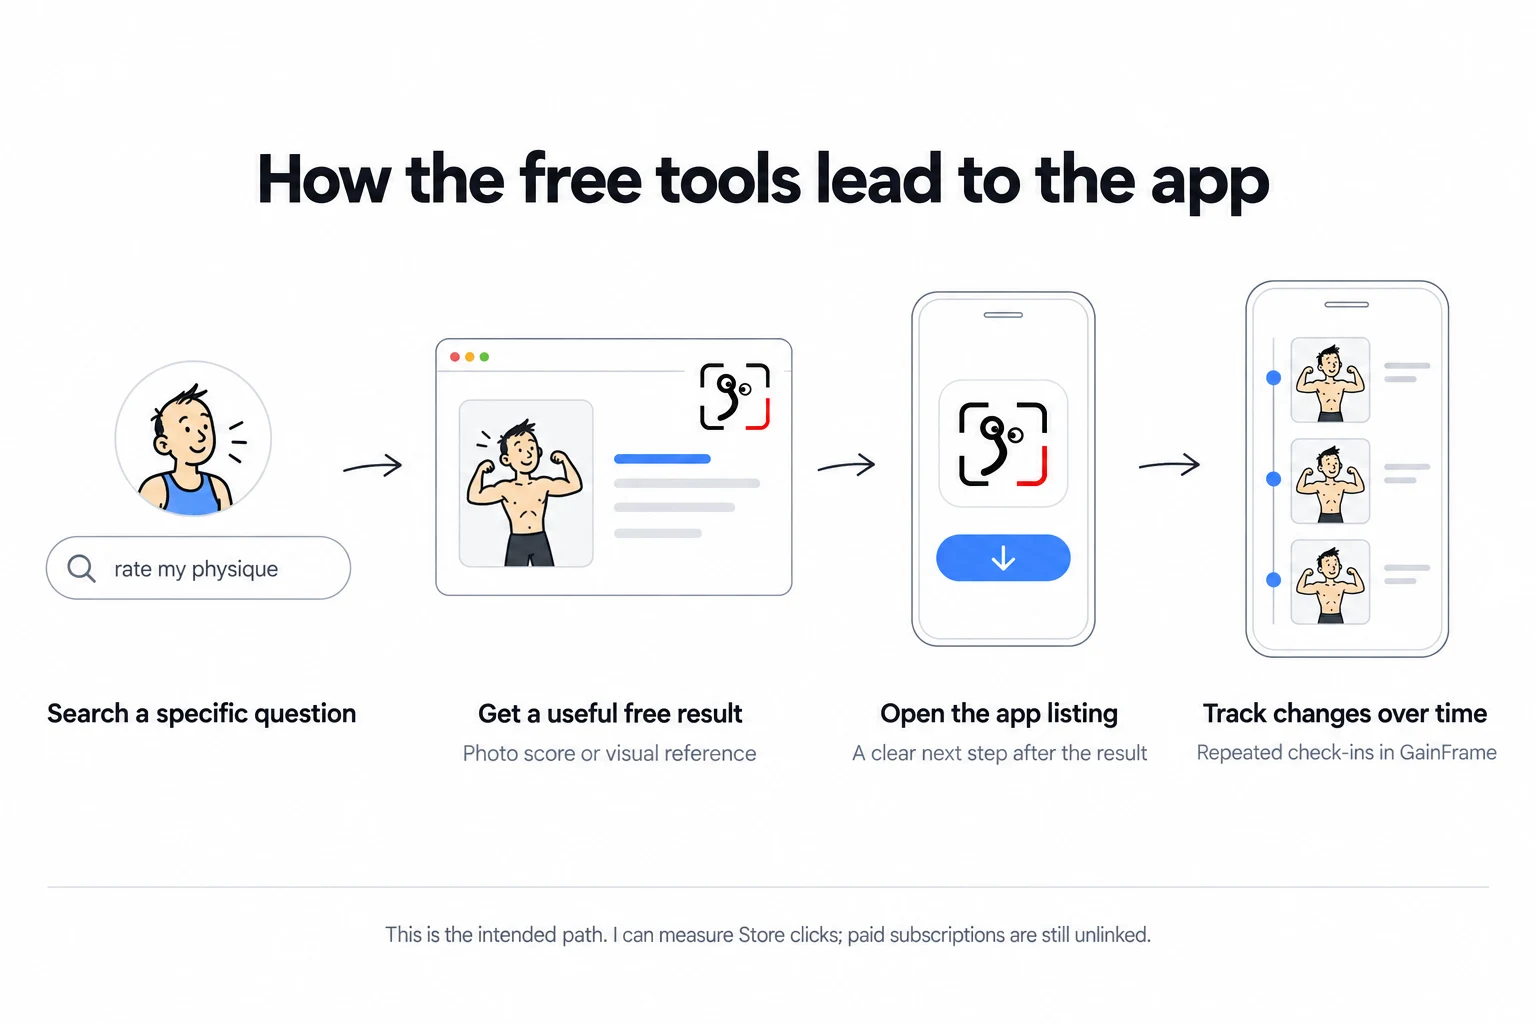
I've also had to work on the result screens. In July, the photo estimator buried the App Store link beneath four competing blocks. I reduced that to one area with the download and email report together. More recently, I've been testing different ways of explaining the next step after a result.
There are now some numbers behind that part of the funnel. The September audit recorded 100 iPhone App Store click events from tool pages in the earlier 28 days, then 258 in the next 28 days. That's a 158% increase. These are tracked click events across traffic sources; a person can click more than once.
There is work left elsewhere. Tracked iPhone Store clicks from blog pages fell from 249 to 188 over the same periods, even as blog search traffic grew. Getting more readers doesn't automatically get more people interested in the app.
What does the audit change about what I build?
I wrote about the audit process in August. I pull Search Console, look at the searches and pages gaining or losing traffic, inspect the site, then pick a small set of changes. I keep a record of when each change shipped so I can leave it alone long enough to see what happens.
That process has changed how I spend my time:
- Use the words people search for. The Physique Rater page was rewritten around searches such as “rate my physique” and “body rater” after Search Console showed what people were typing.
- Link a new tool from relevant pages. A body-fat article can send someone to a photo estimate or visual reference. Those links also make the tools easier to discover while browsing the site.
- Improve the result screen. Once someone has finished using a tool, the next step needs to make sense for the result they just got.
- Give new pages time. Body Visualizer looked tiny when I first reported on it. I planned to wait for 28 days of data before judging it.
It also gives me a reason to stop building things. I can fill a weekend making another calculator pretty easily. The existing results keep pushing me back toward the few tools people already find and use.
“Free” describes what the visitor pays. Building and maintaining the tools takes time, and photo analysis costs me money to run. The photo tools have usage limits. This is still a cost I have to manage as traffic grows.
Where do MRR and total revenue stand?
As of September 15, RevenueCat shows:
| Metric | Amount |
|---|---|
| Monthly recurring revenue | $2,354.65 |
| Total revenue since March | $14,816.20 |
| Revenue in the latest 28 days | $3,690 |
| Active subscriptions | 416 |
The revenue total is after recorded refunds and adjustments, and before store fees, taxes, and my running costs. Annual subscriptions also mean revenue arrives unevenly. MRR spreads subscription value across months, which is why those two revenue numbers describe different things.
The app's numbers are public on RevenueCat's verified page.
Five days ago I wrote that growth had slowed around $2,000 MRR. It has moved up since then, but a few better days don't settle the question of where to spend my time. I'm still trying creator content and posting on social alongside the website work.
The tools have earned more attention because I can see people finding them, using them, and clicking through to the app. Getting the subscription tracking right would help me decide how much more time and money to put into them.
What would I repeat for another app?
I'd start small:
- Find one question people already search for that connects directly to what the app does.
- Build a browser tool that gives them a useful result before asking for anything.
- Explain what they can keep doing in the app after seeing that result.
- Link the tool from the pages where it helps the reader.
- Watch search clicks, successful results, Store clicks, and paid subscriptions separately. Improve the part that is falling behind.
I started with a fitness app and ended up maintaining a small collection of web tools too. More work than I expected (usually how these things go). A few of those pages now bring people in every day.
The business is still small. The tools are useful on their own. I'll keep improving the ones people use and sharing the numbers.
Happy to answer questions.
Try the free tools
Explore the photo estimator, physique rater, and visualizers behind these numbers.
Browse the tools