
Quick answer: Your DEXA scan body fat percentage estimates how much of your measured soft tissue is fat. The report also separates regional fat, lean soft tissue, and bone mineral content. Start with total percentage, then compare fat mass, lean mass, and each region. Repeat scans on the same scanner under similar conditions to reduce measurement variation.
Your scan says 18.6% body fat, 41.7 pounds of fat mass, and 182.1 pounds of lean mass. Another row says your trunk is 19.7%, your arms are 14.6%, and your android/gynoid ratio is 0.89. Suddenly, the single number you booked the scan for has turned into a page of regions, colors, and abbreviations.
I had that exact printout in my hands after a GE Lunar Prodigy scan. The report was useful, but only after I learned which fields were measurements, which were estimates, and which changes were large enough to take seriously.
This guide walks through that real report field by field. It explains body composition for fitness tracking and education. It does not diagnose osteoporosis, metabolic disease, or any other condition. Bring medical questions and unexpected results to your clinician or the qualified professional who performed your scan.
If you are choosing a provider before getting a report, the BodySpec service evaluation covers appointments, pricing options, and result access. It is based on published service information; the report example in this guide is not presented as a BodySpec visit.
What does DEXA scan body fat percentage mean?
DEXA stands for dual-energy X-ray absorptiometry. The scanner sends two low-dose X-ray beams through your body and uses their different attenuation patterns to separate bone mineral from soft tissue. Within soft tissue, the software estimates fat mass and lean soft tissue mass.
The total %Fat field is the scanner software's estimate of the share of measured soft tissue assigned to fat. It is the clearest headline number for a cut, bulk, or recomp. The International Atomic Energy Agency's DXA guide defines the main body-composition outputs as fat mass, lean soft tissue mass, and bone mineral content.
Use the percentage beside the Total row for your whole-body result. Regional percentages answer a different question. They show how the estimated fat and lean tissue are distributed across your arms, legs, trunk, android region, and gynoid region.
Read the label before the number: Total body-fat percentage, trunk body-fat percentage, and android body-fat percentage describe different regions. They should not match.
Which numbers should you read first on a DEXA report?
Start with five fields. Together they describe your current composition and make future comparisons easier.
| Report field | What it means | Best use |
|---|---|---|
| Total %Fat | Estimated percentage of total soft tissue assigned to fat | Your headline body-fat result |
| Fat Mass | Estimated pounds or kilograms of fat | Tracking fat loss or gain |
| Lean Mass | Lean soft tissue, including muscle and body water | Tracking a broader lean-tissue trend |
| BMC | Bone mineral content in pounds or kilograms | Completing the mass breakdown |
| Regional rows | Fat and lean values for arms, legs, trunk, android, and gynoid areas | Comparing distribution and symmetry |
On the real report below, the Total row shows 18.6% body fat, 41.7 pounds of fat mass, 182.1 pounds of lean mass, and 9.0 pounds of bone mineral content. The software also divides the scan into arms, legs, trunk, android, and gynoid regions.
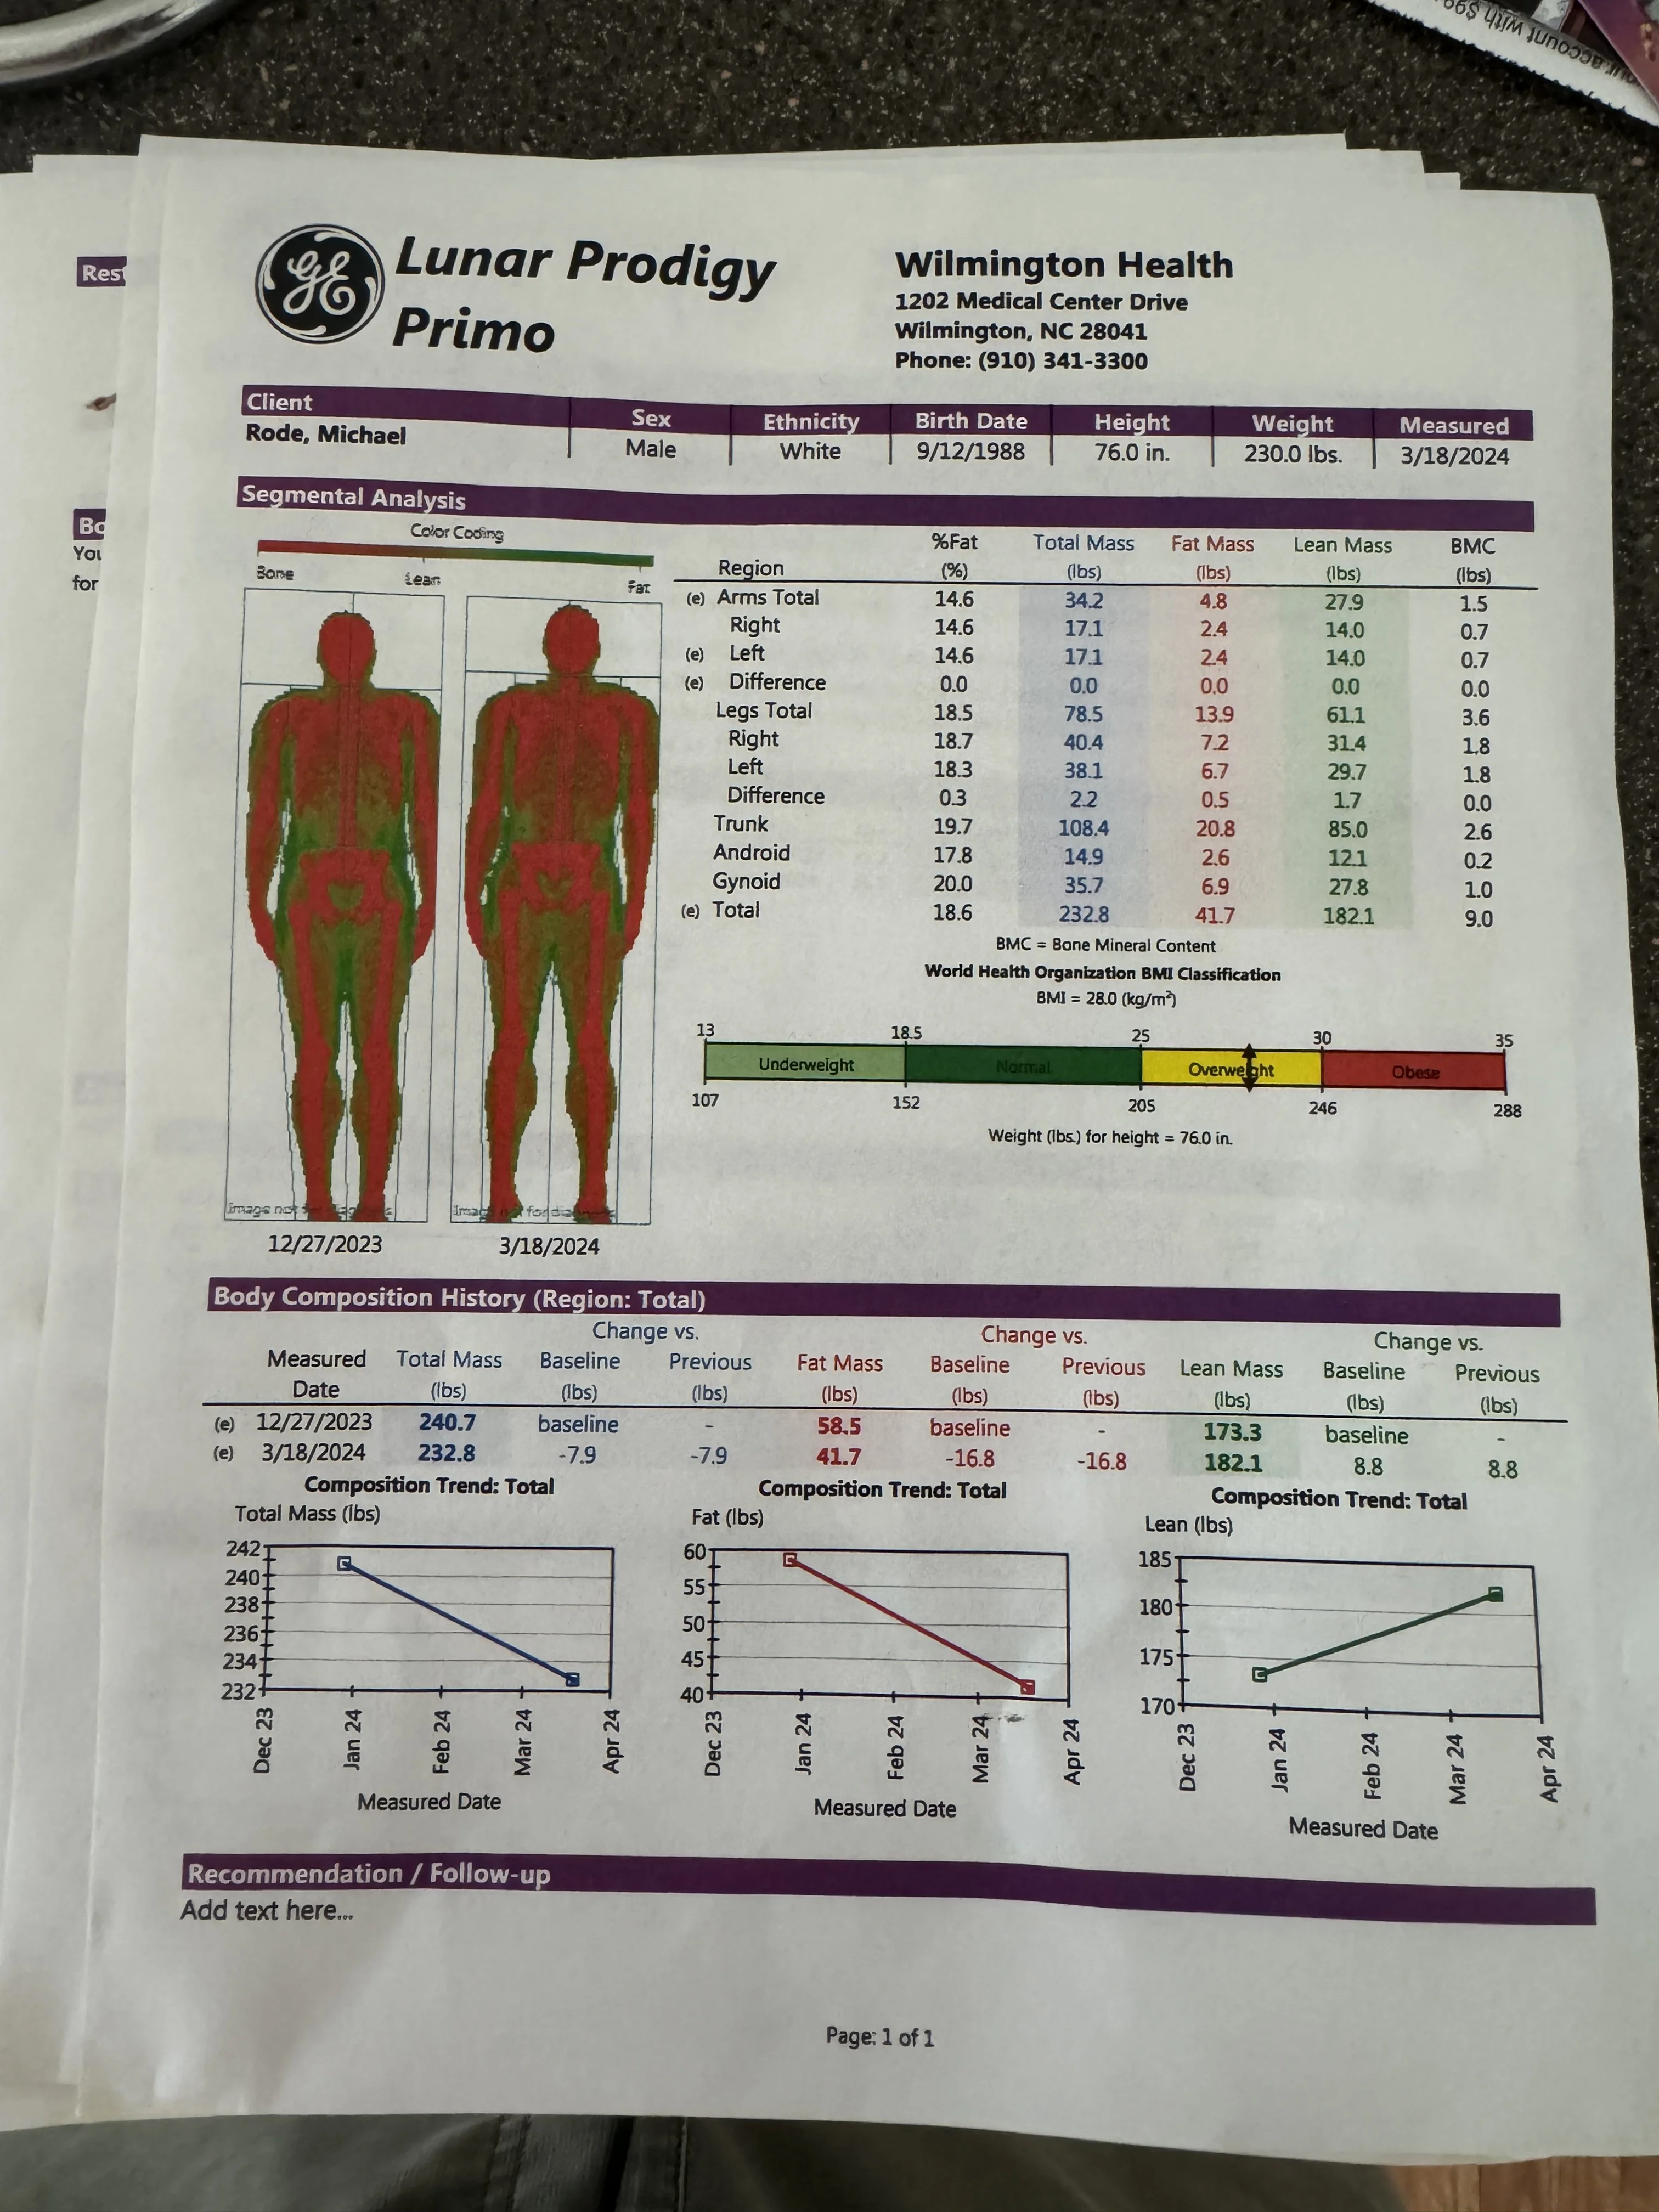
A real GE Lunar Prodigy report with the segmental table and two-scan history. Personal details remain visible because this is the author's own report, shared with permission.
What do regional DEXA results tell you?
The regional table applies the same composition model to smaller areas of your body. Arms and legs may be split into right and left sides. The trunk combines a large area across your chest, abdomen, and back. Android and gynoid rows isolate two smaller fat-distribution regions.
Regional results help answer practical questions:
- Is lean mass changing in both legs at a similar rate?
- Did most fat loss come from the trunk or the limbs?
- Is a right-to-left difference stable across repeated scans?
- Did android fat move differently from gynoid fat?
Treat a small regional difference cautiously. Arm position, body movement, and the software's region boundaries can affect the result. A GE Lunar precision study found low errors for total and most regional measurements, with somewhat higher errors in arm regions. Another study of GE analysis cut-lines showed that an incorrectly placed head boundary could materially change android, gynoid, and visceral-fat values.
That is why a right leg at 31.4 pounds of lean mass and a left leg at 29.7 pounds deserves context. Repeating the asymmetry under the same protocol makes it more informative than seeing it once.
What are fat mass, lean mass, and bone mineral content?
Fat mass is the estimated mass of fat in the selected region. It gives body-fat percentage a real unit. Losing four percentage points can mean different amounts of fat depending on how your total mass changed, so read percentage and fat mass together.
Lean mass is lean soft tissue. It includes muscle, water, organs, skin, connective tissue, and other non-fat soft tissues. DEXA does not isolate skeletal muscle directly. A lean-mass increase can support a muscle-gain conclusion when it agrees with your lifting performance, circumference measurements, body weight, and repeated scans.
Bone mineral content, usually labeled BMC, is the estimated mass of mineral in the scanned bones. BMC is different from bone mineral density, or BMD. A whole-body fitness report showing BMC does not replace a diagnostic hip or spine bone-density assessment with T-scores and Z-scores. The CDC's DEXA overview explains the separate clinical bone-density use.
What does the android/gynoid ratio mean?
The android region covers part of the abdomen. The gynoid region covers part of the hips and upper thighs. Your A/G ratio compares the fat distribution in those two software-defined regions.
A higher ratio indicates a more abdomen-dominant distribution relative to the hips and thighs. In the example report, android fat was 17.8%, gynoid fat was 20.0%, and the A/G ratio was 0.89. The number describes distribution. It does not diagnose disease by itself.
Scanner brands and software can define regions differently, so use the facility's reference information when interpreting a single value. For progress, compare the same ratio from the same system. That keeps the region definitions consistent.
How should you interpret a DEXA visceral-fat estimate?
Some scanners add a visceral adipose tissue, or VAT, estimate. GE's CoreScan software estimates VAT mass and volume inside the android region. The manufacturer's CoreScan information identifies this as a DXA-derived estimate.
The second page of this real report shows 0.27 pounds and 7.94 cubic inches of estimated VAT at the latest scan. It also shows the android/gynoid history that supplies context for the abdominal estimate.
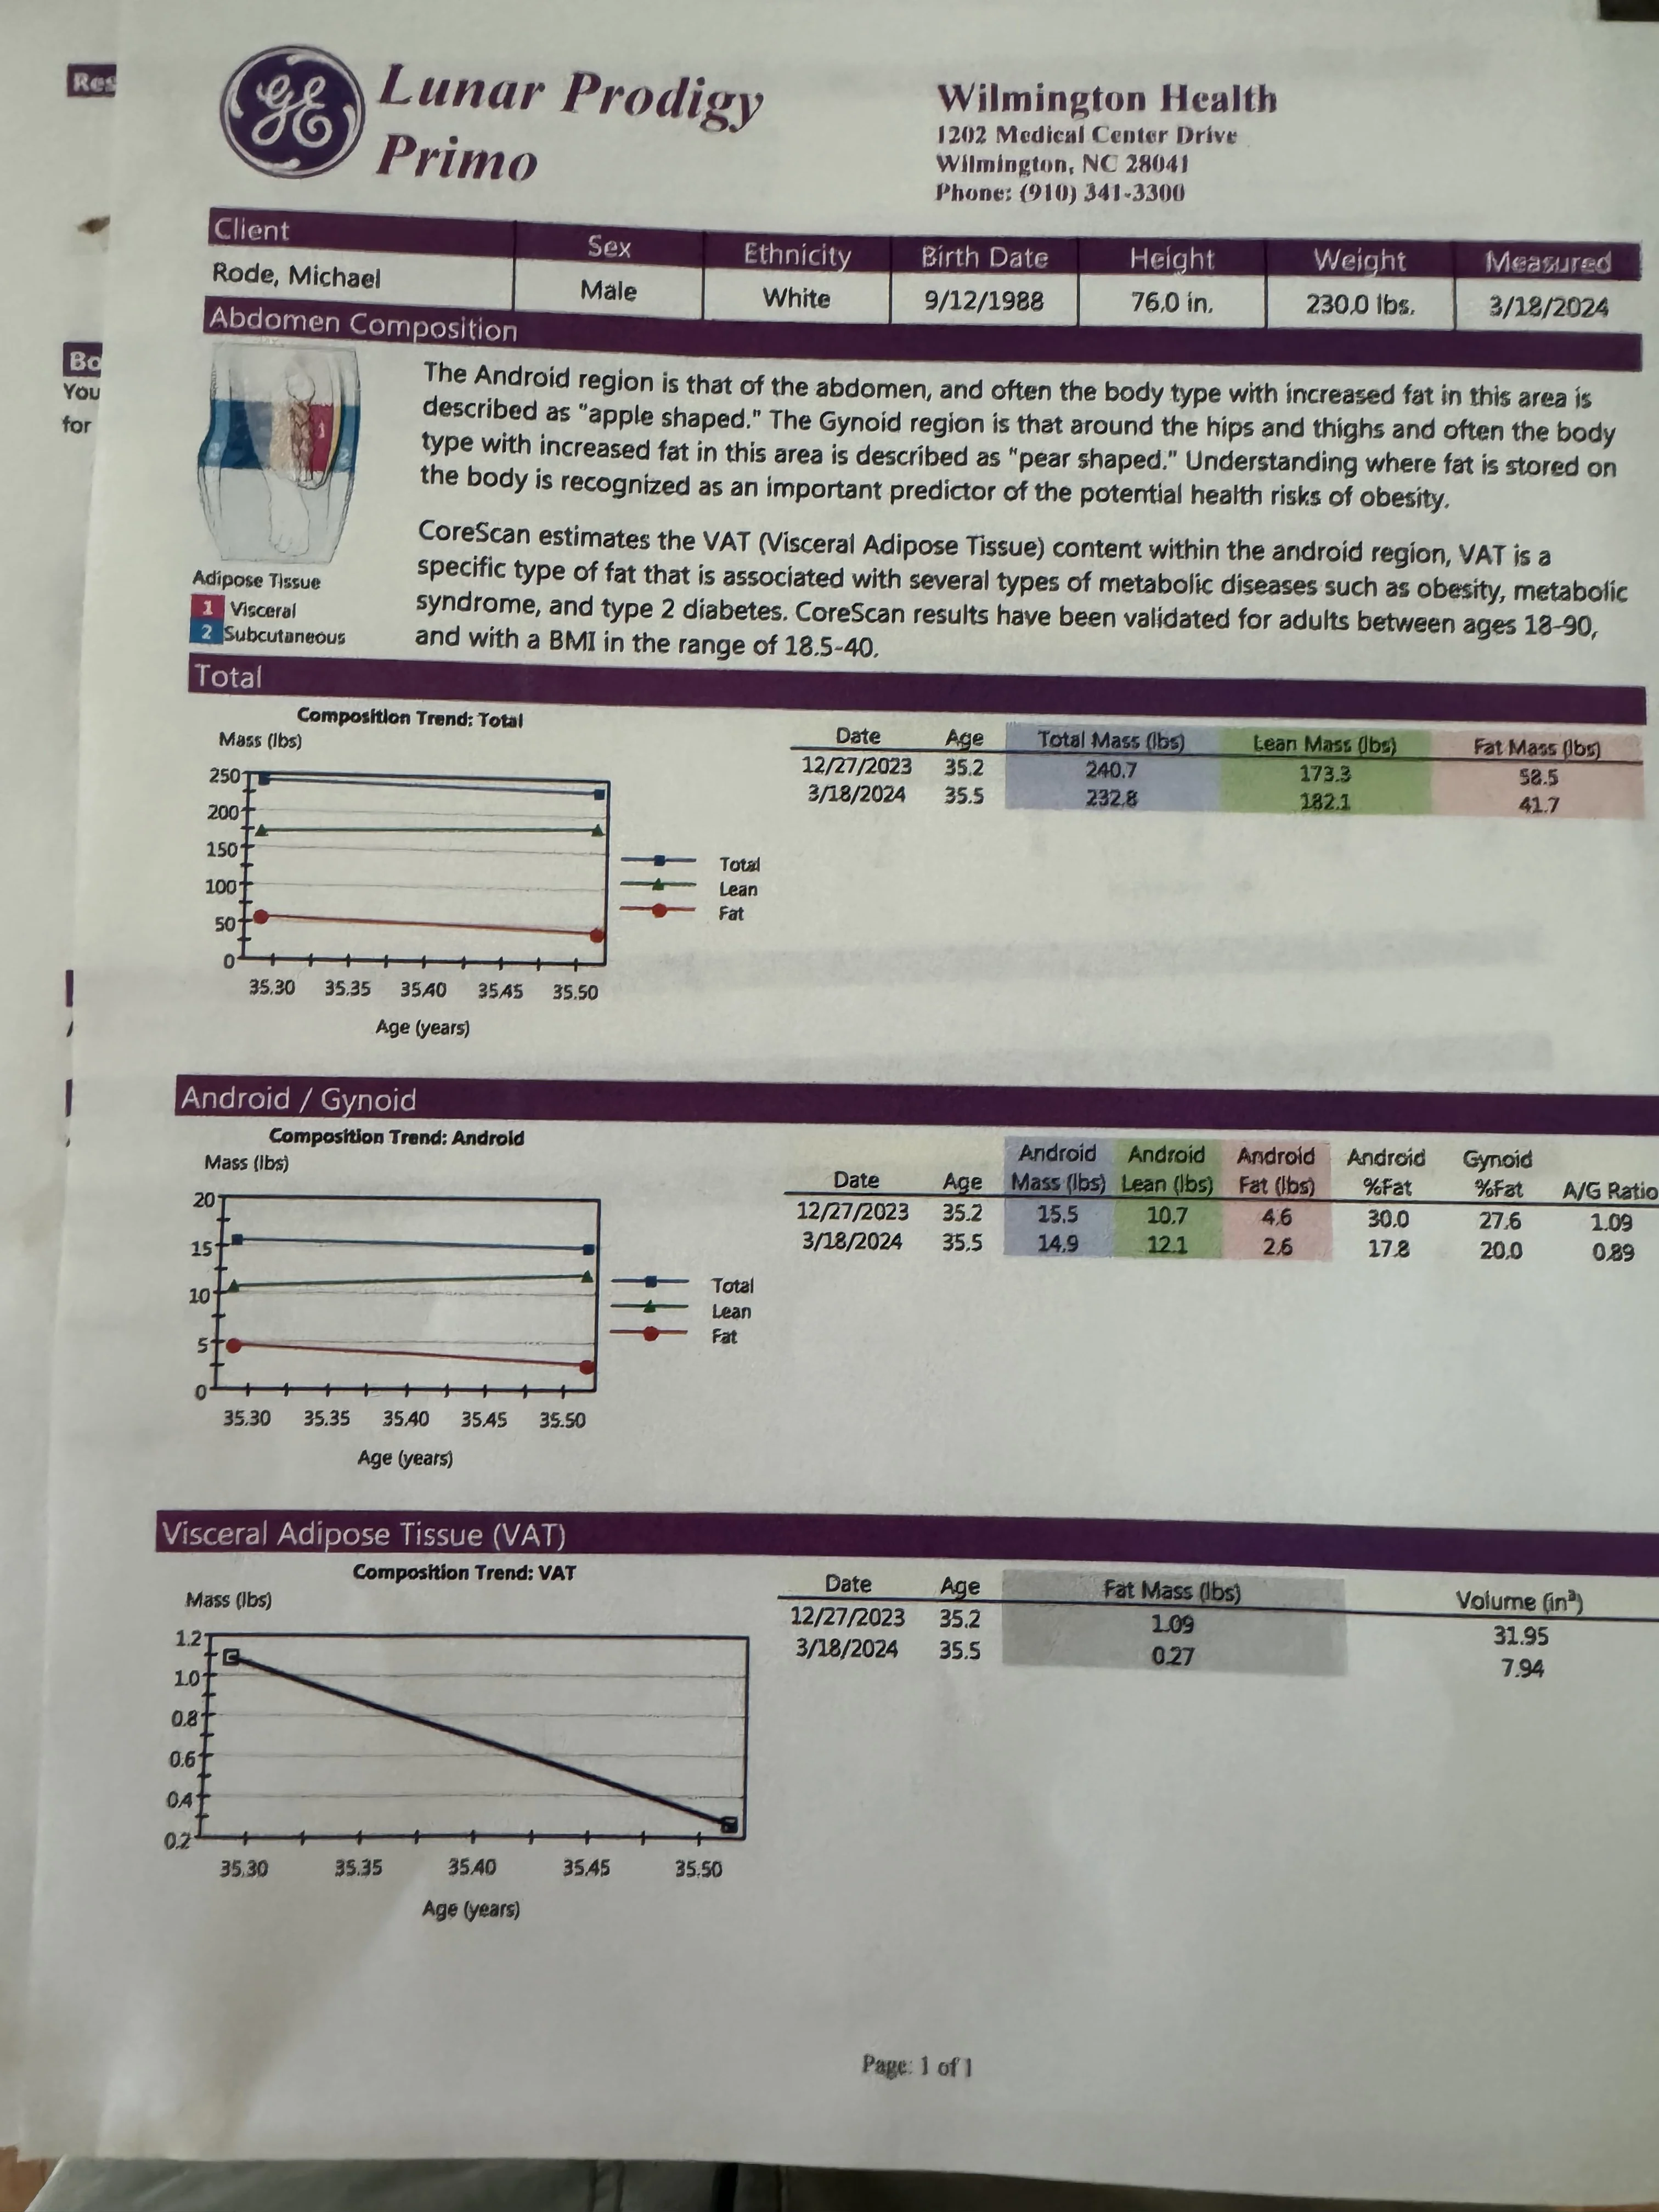
The abdomen page separates android and gynoid regions and reports a CoreScan visceral-fat estimate. Read the estimate as a trend field rather than a diagnosis.
CT and MRI produce anatomical images that can directly separate visceral and subcutaneous fat. DXA derives its VAT value from the scan and software model. Research supports its usefulness, while also showing limits. Our guide to testing for visceral fat compares these methods with smart scales and waist measurements. A GE iDXA repeatability study found much higher variation for VAT than for other compartments when VAT mass was below 500 grams.
Your scan provider can explain its reference range, software version, and precision limits. A clinician should interpret a VAT result when it relates to a health concern.
If another facility gave you a different number, read why BOD POD and DEXA results differ before combining the two methods into one progress trend.
How should you compare DEXA scans over time?
First, compare like with like. A number from one scanner should not be treated as interchangeable with a number from another model or software version. The same facility, scanner, positioning protocol, and analysis boundaries give you the cleanest trend.
Second, compare both percentages and masses. A successful recomp could show a small change in scale weight alongside lower fat mass and higher lean mass. Looking only at total body-fat percentage hides part of that story.
Third, ask whether the difference exceeds measurement noise. Facilities can calculate a precision error and a least significant change, which is the amount a result generally needs to move before the change is likely to be larger than ordinary test variation. The threshold is specific to the scanner, staff, protocol, and metric.
In the example report, total fat mass moved from 58.5 to 41.7 pounds while lean mass moved from 173.3 to 182.1 pounds over nearly three months. Those are large changes across several related fields. A shift of a few tenths in one regional value would deserve much more restraint.
How can you prepare for a repeat DEXA scan?
Follow the facility's instructions first. Their protocol should override a generic online checklist. For useful serial comparisons, reproduce the conditions of your prior scan as closely as practical.
Quick checklist:
- Use the same facility and scanner model.
- Book a similar time of day.
- Arrive similarly hydrated and avoid unusual fluid loading.
- Match your recent food intake and follow the facility's fasting guidance.
- Avoid a hard workout beforehand when lean-mass comparisons matter.
- Wear light clothing without metal and remove jewelry when instructed.
- Tell the facility if you may be pregnant or recently had contrast imaging.
- Lie still and follow the technician's positioning instructions.
UC Davis Sports Medicine advises arriving well hydrated, avoiding food for at least three hours, minimizing metal, and discussing pregnancy or recent contrast procedures. The CDC's NHANES whole-body DXA protocol emphasizes metal removal, consistent positioning, and remaining still.
Published research also shows why consistency matters. Hydration and glycogen changes can move lean soft tissue estimates. A body-composition DXA review recommends standardized activity, food intake, and time of day for repeated scans.
What can a DEXA body-composition report miss?
DEXA is a strong reference method, yet its model has boundaries.
- Lean mass is broader than muscle. Water and other lean tissues contribute to the value.
- Regional boundaries are software-defined. Technician review and positioning can alter smaller regions.
- VAT is estimated. The scanner does not create the same anatomical fat image as CT or MRI.
- Different systems can disagree. Scanner hardware, software, and calibration matter.
- One scan cannot establish a trend. It gives you a baseline at one point in time.
- Fitness reports are non-diagnostic. Medical concerns require a qualified clinician.
A photo-based estimate can fill the long gap between lab visits when you want a weekly visual trend. GainFrame can organize progress photos and estimate body composition from them, but the result remains an AI estimate and does not replace a DEXA measurement or clinical assessment.
What should you do after reading your DEXA report?
Use this four-step process for the next scan:
- Repeat the measurement system. Book the same facility and scanner model when possible, and ask whether the software version changed.
- Standardize your preparation. Match the time of day, hydration, recent food, clothing, and training conditions from your prior scan.
- Record the same report fields. Track total body-fat percentage, fat mass, lean mass, regional values, android/gynoid ratio, and visceral-fat estimate when available.
- Check whether the change is meaningful. Ask the facility for its precision error or least significant change before treating a small difference as biological progress.
Your best summary fits on one line: total body-fat percentage, fat mass, lean mass, plus the date and scan conditions. Add regional values only when they answer a real question about distribution, symmetry, or a training goal.
Which sources support this DEXA report guide?
- IAEA: Dual Energy X Ray Absorptiometry for Bone Mineral Density and Body Composition Assessment
- GE HealthCare: CoreScan visceral adipose tissue quantification
- CDC: NHANES Body Composition Procedures Manual
- UC Davis Health: DXA body composition analysis and preparation
- PubMed: Precision of GE Lunar iDXA for total and regional body composition
- PubMed: Scan analysis errors in GE Lunar DXA visceral adiposity
- PubMed: Reliability of compartmental measures using GE iDXA
- PMC: Body composition with DXA, from basics to new tools
What do people ask about DEXA body-fat reports?
Is DEXA body-fat percentage accurate?
DEXA is a precise, widely used reference method for estimating body composition, yet it is still an estimate. Scanner model, software, positioning, hydration, recent food, and analysis regions can affect results. Treat one scan as a strong baseline. For progress, repeat under similar conditions on the same machine and focus on changes larger than the facility's reported precision error.
Why is my DEXA body-fat percentage different from my scale?
DEXA and bioelectrical impedance scales use different measurement models. DEXA infers tissue composition from two X-ray energies, while a smart scale estimates it from electrical impedance plus an algorithm. Hydration, food, exercise, device assumptions, and timing can move the numbers. Pick one method for your trend instead of comparing absolute percentages across devices.
Does a DEXA scan measure visceral fat?
Some DEXA systems estimate visceral adipose tissue within the abdominal android region. The estimate is useful for serial comparison, especially when the same scanner and analysis protocol are used. CT and MRI create direct anatomical images of visceral fat, so a DEXA visceral-fat value should never be treated as a stand-alone diagnosis.
How often should you repeat a DEXA body-composition scan?
For most fitness goals, repeating a whole-body scan every three to six months gives enough time for changes in fat or lean mass to exceed normal measurement noise. Faster retesting may help in a supervised clinical or research program. Follow the timing recommended by your clinician or facility, especially when bone health or a medical condition is involved.
Can muscle gain show up as lean mass on a DEXA report?
DEXA lean mass includes water, organs, connective tissue, and muscle rather than isolated skeletal muscle. A rising regional lean-mass value can support evidence of muscle gain when your training, body weight, and measurements agree. Hydration and glycogen also influence lean soft tissue, which is why standardized preparation matters when comparing scans.
Track what changes between DEXA scans
Keep a consistent progress-photo timeline between lab visits. Use it for visual trends, then use your next DEXA scan as the stronger composition checkpoint.
Download GainFrame Free