
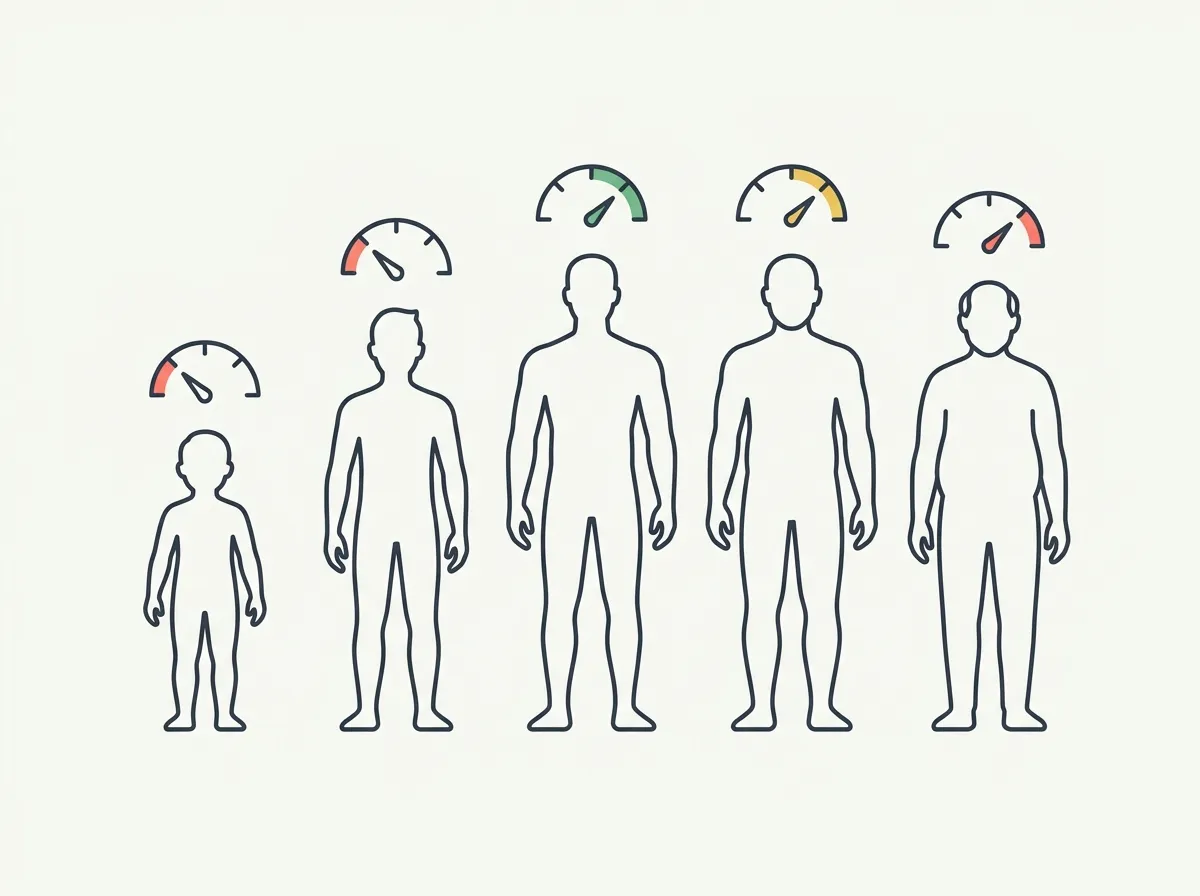
Quick answer: Commonly cited survey data puts average body fat around 23-30% for men and 32-42% for women, climbing each decade. Commonly cited healthy ranges are lower - roughly 8-24% for men and 21-35% for women depending on age. Average is not healthy: averages track a population losing muscle every decade.
Your smart scale says 26%. At 25 you were somewhere around 18% without trying, and now you're 45 and staring at a number eight points higher, wondering how much of that is normal aging and how much is you.
Here's the honest version: some of the drift is physiology, most of it is behavior, and "normal for your age" is a much lower bar than "healthy for your age." This page gives you both numbers, by decade, for men and women - and shows you what the same percentage actually looks like at 25, 45, and 65.
What is the average body fat percentage by age?
The tables below combine two different things, and the difference matters. The average column reflects figures commonly cited from national health survey data - what the population actually measures. The healthy range column reflects commonly cited ranges from published body-composition tables - what's associated with good health markers.
Treat every number as a range with soft edges. Different surveys, measurement methods, and populations produce different figures, which is why anyone quoting you a single decimal-point "average" is overselling their data.
Men: average vs healthy body fat by age
| Age | Commonly cited average | Commonly cited healthy range |
|---|---|---|
| 20-29 | ~23-25% | 8-19% |
| 30-39 | ~25-27% | 8-19% |
| 40-49 | ~26-28% | 11-21% |
| 50-59 | ~27-29% | 11-21% |
| 60-69 | ~28-30% | 13-24% |
Women: average vs healthy body fat by age
| Age | Commonly cited average | Commonly cited healthy range |
|---|---|---|
| 20-29 | ~32-35% | 21-32% |
| 30-39 | ~35-38% | 21-32% |
| 40-49 | ~37-39% | 23-33% |
| 50-59 | ~38-41% | 23-33% |
| 60-69 | ~39-42% | 24-35% |
Two patterns jump out. First, the average sits above the healthy range in every single bracket, for both sexes. Second, the gap doesn't close with age - it holds at roughly 5-10 points from your 20s through your 60s.
Women's numbers run higher than men's across the board because essential fat - the minimum needed for basic function - is roughly 10-13% for women versus 2-5% for men. That's biology, not a fitness gap. For a dedicated look at the male baseline, see our guide to average body fat percentage for men. If you want to see what specific percentages look like level by level, our body fat percentage chart with photos walks through each range visually.
Why does average body fat rise with age?
Three forces stack on top of each other, and only one of them is hard to fight.
Muscle loss. Adults who don't strength train lose muscle steadily - figures commonly cited land around 3-8% of muscle mass per decade after age 30, accelerating past 60. Less muscle means a lower resting calorie burn, and it means body fat percentage rises even if fat mass stays flat, because the denominator shrinks.
Hormones. Testosterone in men declines gradually from roughly the mid-30s onward. For women, menopause shifts fat storage patterns and makes holding muscle harder. These changes are real, but they tilt the field - they don't decide the game.
Behavior. Activity drops through the 30s and 40s while calorie intake mostly doesn't. This is the biggest lever and the only fully controllable one, which is why lifelong lifters in their 50s routinely measure leaner than sedentary 25-year-olds.
The practical takeaway: the average rises with age largely because the average person stops doing the things that hold it down.
What does the same body fat percentage look like at different ages?
This is where charts fail and pictures help. The images below are standardized, photorealistic AI renders from our body fat visualizer - same build, pose, and lighting, so only age changes between the male images.
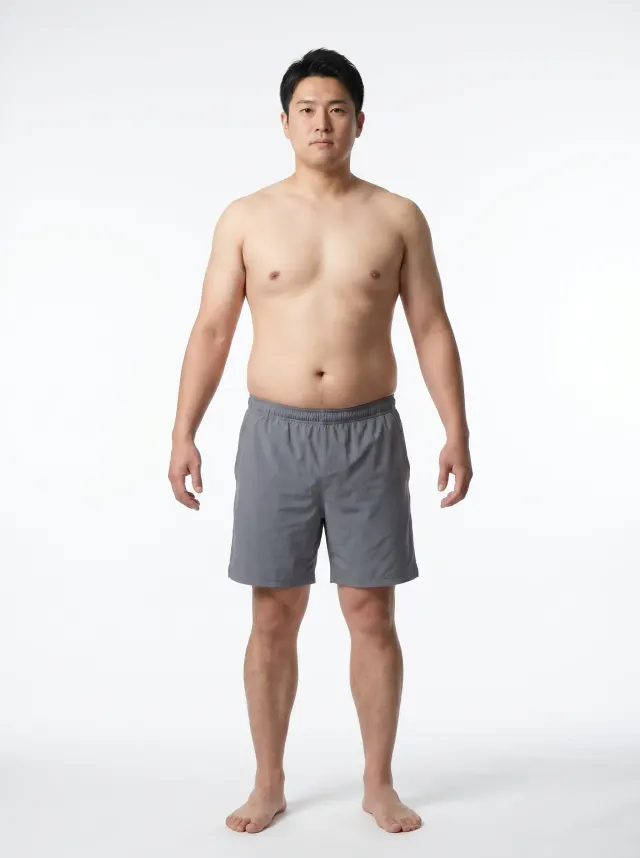
23% body fat in the 20s - right around the commonly cited average for that decade. Soft midsection, no visible muscle separation.
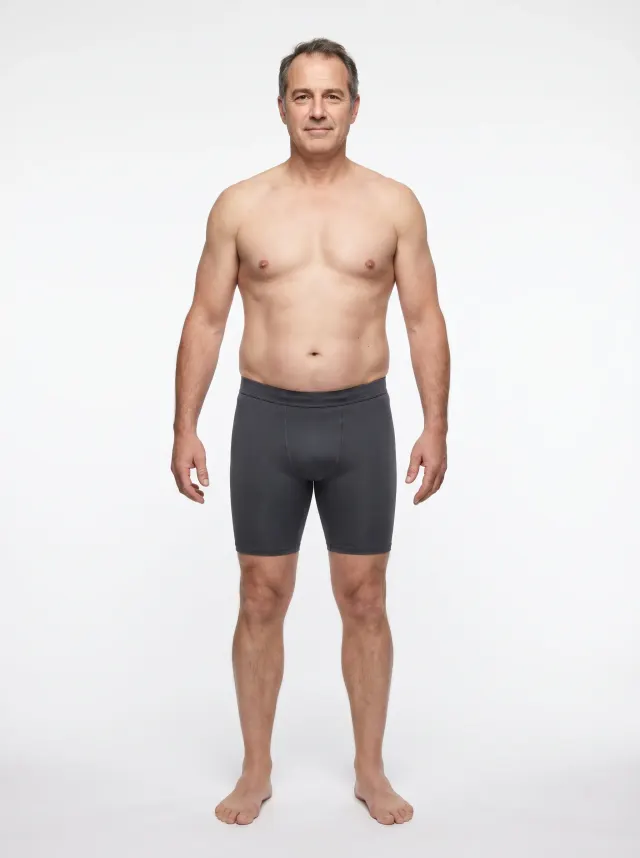
The same 23% in the 40s. Fat distribution shifts toward the midsection, so an identical percentage reads as a slightly rounder waist.
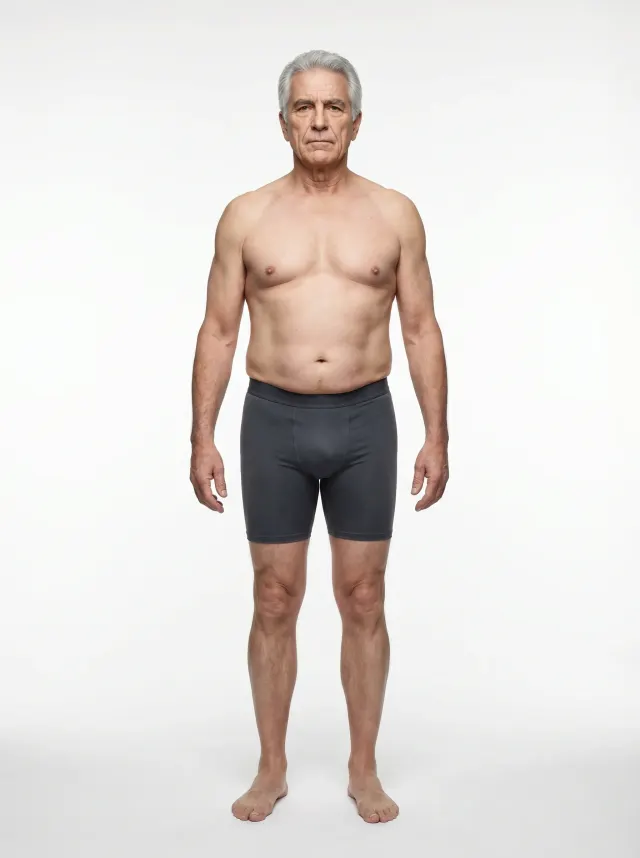
23% in the 60s - now several points leaner than the commonly cited average. Skin and muscle changes alter the look, but the leanness is obvious.
Same percentage, three verdicts. At 25, 23% is average. At 45, it's a touch better than average. At 65, it's meaningfully lean. The number didn't change - the population around it did.
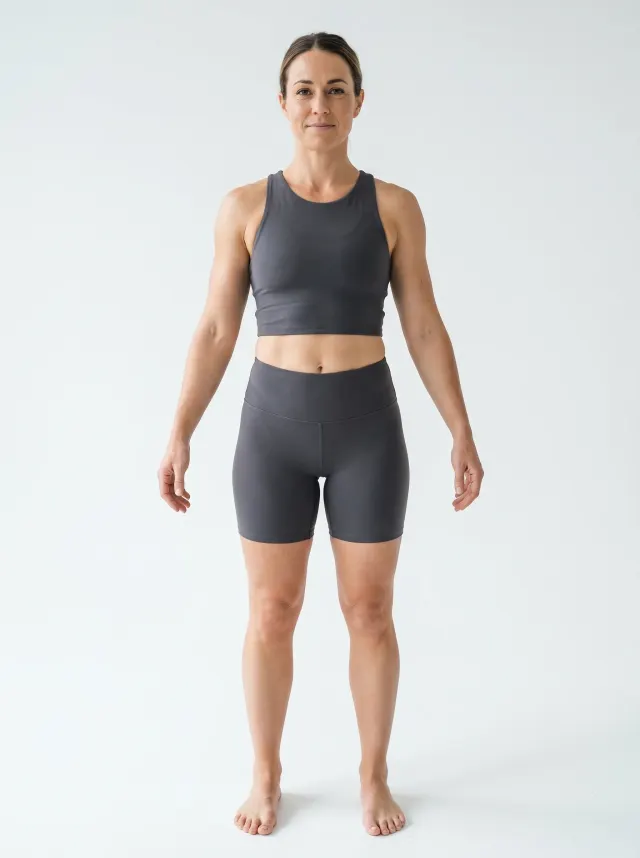
A woman in her 30s at 27% - comfortably inside the commonly cited healthy range for her age, and several points under the average.
To study one level at a time, the body fat picture gallery has a reference page per level for both sexes - 20% body fat on a man and 30% on a woman are useful starting points for the age-band averages above.
For the full per-percentage walkthrough - what 8%, 13%, 18%, and every level in between looks like - head to the body fat percentage chart. This page is about the age brackets; that one covers the levels.
What is the average body fat percentage for a 40-year-old man?
Commonly cited survey figures put a man in his 40s around 26-28% body fat. The commonly cited healthy range for the same decade runs roughly 11-21%.
Read those two numbers together and the story is blunt: the average 40-year-old man sits about 5-10 points above where the healthy range ends. He isn't unusual - he's typical. Typical just isn't the same thing as fine.
If you're a 40-something man at 20-22%, you're leaner than most of your age group while still having visible room to improve. That dual reading - above average, below optimal - describes an enormous number of lifters in their 40s, and it's a much more useful frame than either "I'm fat" or "I'm fine."
Is average body fat the same as healthy?
No, and this is the trap in every "by age" chart. Averages describe what a population is; healthy ranges describe what physiology rewards. When most of the population is sedentary and a majority of adults are overweight, the average necessarily lands above the healthy band.
There's a second trap hiding inside the first: using age brackets as permission. The healthy ranges do widen slightly with age - carrying 22% at 60 is a different situation than carrying 22% at 25 - but they widen by a few points, not by the 10-point drift the averages show. Aging explains a small shift. It doesn't explain the whole gap.
And percentage alone can mislead in one more way: a "normal" body fat percentage with very little muscle underneath is its own problem. If your number looks fine but the mirror doesn't, our guide to telling if you're skinny fat covers that exact case.
How do you find out where you actually stand?
A chart is only useful if you have a number to look up, and most people are guessing theirs - commonly off by five or more points in the flattering direction.
Your realistic options, cheapest first: compare yourself honestly against visual references, use a smart scale (noisy day to day, decent for trends), get a DEXA scan for a clinical anchor, or use photo-based estimation. GainFrame does the last one - you take a physique photo and it estimates body fat percentage along with FFMI and per-muscle-group ratings, so the age-chart question and the muscle question get answered from the same photo. It's an estimate from photos, not a clinical measurement, but it's consistent - and for tracking your trend against these brackets, consistency beats precision. You can also try it without the app: the free browser body fat estimator runs one scan a day, no download or signup.
Whichever method you pick, keep it constant. Switching between methods creates phantom progress and phantom setbacks, because each method has its own bias.
Frequently asked questions
What is the average body fat percentage for a 40-year-old man?
Commonly cited survey data puts the average man in his 40s somewhere around 26-28% body fat. Commonly cited healthy ranges for that age sit lower, roughly 11-21%. The gap exists because averages include a largely sedentary population - a 40-year-old who lifts and stays active usually lands well under the average.
What is a healthy body fat percentage for a 50-year-old woman?
Commonly cited healthy ranges for women in their 50s run roughly 23-33%, while the commonly cited average sits higher, around 38-41%. Women's ranges are always higher than men's because essential fat for women is roughly 10-13% versus 2-5% for men. Where you feel and perform best within the healthy range is individual.
Why is the average body fat percentage higher than the healthy range?
Because averages describe the population as it is, not as physiology recommends. In countries where most adults are sedentary and a majority are overweight, the population average drifts well above the ranges associated with good health markers. Matching the average means matching a group that loses muscle every decade - it is a statistic, not a target.
Does body fat percentage naturally increase with age?
Partly. Hormonal shifts and gradual muscle loss - commonly cited at roughly 3-8% of muscle mass per decade after 30 - nudge composition toward fat even at a stable weight. But a large share of the increase is behavioral: less activity, unchanged calories. Adults who keep lifting and moving typically show far smaller age-related increases.
How accurate are body fat charts by age?
Treat them as orientation, not diagnosis. Published averages vary by survey, measurement method, and population, which is why honest charts show ranges rather than single numbers. Your own reading carries error too - smart scales and photo estimates can differ by several points. The chart tells you the neighborhood; a consistent measurement method tells you your trend.
Find your number, not the average's
GainFrame estimates your body fat percentage, FFMI, and 12 muscle-group ratings from a photo - so you can see where you sit against your age bracket and track the trend. Free to start on iOS.
Download GainFrame Free