

Quick answer: Your InBody score summarizes aspects of body composition using the device’s scoring system. It is not a percentage or a complete health assessment. Read it alongside skeletal muscle mass, body-fat mass and repeatable test conditions. Manufacturer guidance uses 80 as a reference in some explanations, and muscular people can score above 100.
Your score rises from 78 to 81, but your lifts barely change. A friend gets 95, and suddenly your own result feels disappointing. InBody score comparisons can create more questions than they answer when you skip the report beneath the number.
This guide uses InBody's own documentation, checked October 27, 2026. It explains how to read the score as part of a progress record, including why you should be careful with universal score charts and the claim that every result is simply “out of 100.”
What is an InBody score?
InBody USA describes the score as a simplified output for summarizing body-composition distribution and tracking changes. It condenses several aspects of the report into a number you can follow over time.
That convenience is also its limitation. The same movement in a summary number does not explain which underlying field changed, whether your testing setup stayed comparable, or whether your training is accomplishing your goal.
Use the score as an entry point. Then open the muscle-fat section and history. If you are deciding between testing methods, our InBody vs DEXA guide explains why results from different systems should retain their source labels.
Is an InBody score of 80 good?
InBody's Japanese explanation of the score uses 80 as a reference for its standard composition. It also describes adjustments based on body composition and provides examples above 100. That makes 80 a manufacturer reference point in that explanation, rather than a universal pass mark for health or fitness.
Regional summaries are not perfectly aligned. InBody India's score article describes a 0-to-100 range, while the Japanese explanation explicitly discusses higher results. Check the documentation for the device and report you received before treating an online chart as a universal rule.
For your own progress, ask a more useful question: what changed underneath the score, and does it fit my goal? A person working to improve gym performance needs different context from someone simply trying to make a chart's headline number rise.
Which report fields should you read beside the score?
Start with the names and units. A percentage, a mass and a proprietary score represent different things. Keep each in its own column when recording a result.
| Field | What it describes | Question to ask |
|---|---|---|
| InBody score | The manufacturer's summary index | Which underlying fields explain the change? |
| Weight | Total body mass at testing | Was the testing context comparable? |
| Body-fat mass | Estimated mass attributed to fat | Is the longer pattern consistent with other records? |
| Percent body fat (PBF) | Estimated fat as a proportion of weight | Did fat mass change, body weight change, or both? |
| Skeletal muscle mass (SMM) | The skeletal-muscle estimate | Does the pattern fit training performance and measurements? |
| Fat-free mass (FFM) | Mass excluding body fat | Am I mistakenly treating all of this as skeletal muscle? |
The distinction between SMM and FFM is especially useful. Fat-free mass includes body water and other non-fat components. It is larger than the skeletal-muscle field and should not be copied into a muscle-specific entry in another app.
What does an actual sample report show?
The public InBody 270S example below makes the terminology concrete. Its research-parameters area lists 180.1 lb of fat-free mass, while its muscle-fat section lists 105.8 lb of skeletal muscle mass. Those are two differently defined outputs on the same manufacturer example.
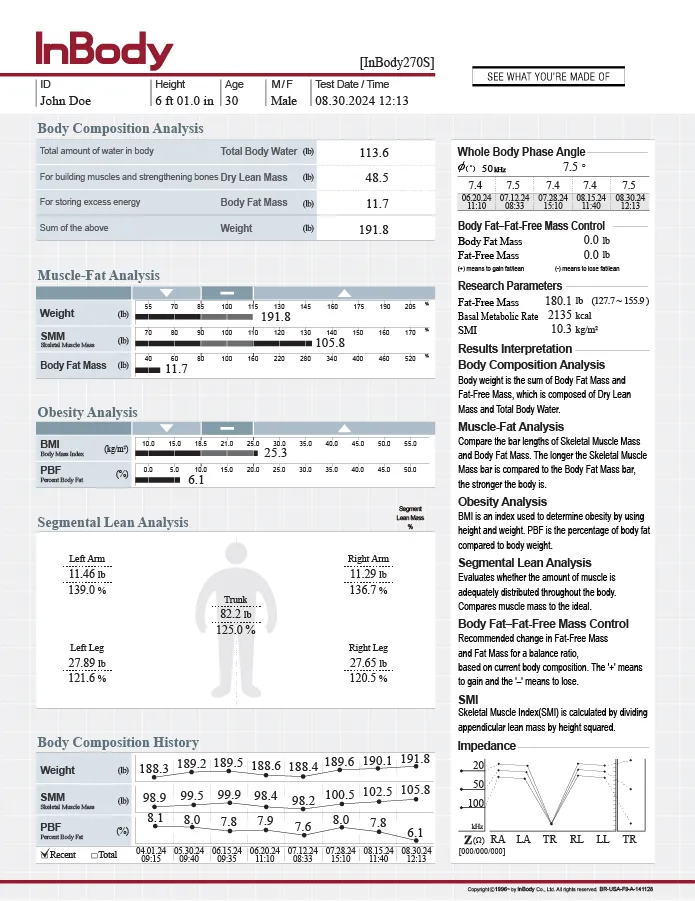
Official public sample from InBody USA. Read SMM in the left muscle-fat section, FFM under research parameters on the right, and the history at the bottom. This example does not display a headline InBody score, illustrating why report layouts matter.
This is a manufacturer example for reading fields, not a suggested physique target. Its numbers are not the author's results and should not be used as a benchmark for your body.
If your printout looks different, identify the device model first. InBody's support guide directs readers to model-specific result-sheet interpretations. Ask the testing facility to explain a field that is missing or labelled differently.
Why can your InBody score change unexpectedly?
The summary inherits uncertainty and variation from the underlying assessment. InBody's US guide identifies preparation, hand and foot contact, movement and other testing factors as reasons results can vary. A score change therefore deserves context before you label it a body change.
A useful check begins with what you can verify. Was it the same device? Were you measured under similar conditions? Did the operator use the correct profile and follow the preparation procedure? Did you change the timing relative to training or meals?
Do not try to manipulate hydration or repeatedly retest until you obtain a preferred score. A deliberately altered routine makes the comparison harder to interpret. Follow the facility's preparation instructions and ask about an unexpected result.
How should you compare two InBody results?
Keep a small worksheet with one row per appointment. The aim is to make later comparisons understandable, rather than to collect every number the machine can display.
- Source: facility, model and testing date.
- Conditions: time of day and any departure from the usual preparation.
- Core fields: score if present, weight, PBF, fat mass and SMM, with units.
- Training context: a few repeatable lifts and any relevant program change.
- Other progress: waist and consistent photos taken near the same period.
If the score improves while your performance and other records remain stable, inspect which field drove it. If your lifts improve while the score remains similar, the training improvement still belongs in your record. A single summary index cannot capture everything you are practicing in the gym.
Our muscle-gain progress guide helps you combine those signals. For visual context, the free progress-photo comparison tool aligns two check-ins. Photos cannot calculate an InBody score or verify its composition estimates.
Should you try to maximize your InBody score?
Set a goal you can describe without the number first. It might involve getting stronger in specific movements, completing a training phase consistently or reviewing a body-composition trend with a qualified professional. Then use the report to contribute evidence toward that goal.
A higher score does not establish better technique, endurance, mobility or overall health. It also does not tell you that an aggressive change in diet is appropriate. Avoid replacing your actual objective with a competition over the largest displayed result.
First, identify the model and read its report definitions. Second, record the underlying fields and testing conditions. Third, compare the longer pattern with your training and appearance records before deciding what to change.
What else should you know?
Is 80 a good InBody score?
InBody uses 80 as a reference in some manufacturer explanations, but it is not a universal health pass mark. Interpret your result using the device’s report guidance and the muscle and fat fields underneath it. Your training goal, testing conditions and longer history provide more context than a single threshold.
Can an InBody score be above 100?
Yes. InBody’s Japanese score explanation includes results above 100, even though some regional summaries describe the score as a 0-to-100 range. This is one reason to check the specific model and report documentation. A higher value remains a composition index and does not establish superior overall health or athletic performance.
Is InBody score the same as body-fat percentage?
No. Body-fat percentage estimates the proportion of your weight attributed to fat. The InBody score is a manufacturer-defined summary index. Keep the two fields separate, and also examine fat mass and muscle-related outputs. A percentage can change when total body weight changes, so the score alone cannot explain the full pattern.
Why did my InBody score fall even though I am stronger?
Strength performance and a body-composition score describe different aspects of progress. Testing conditions can also affect the underlying estimates. Review the muscle and fat fields, the device and preparation routine, and your longer history. A lower score on one appointment does not erase a documented improvement in your gym performance.
How do I improve my InBody score safely?
Begin with your actual fitness objective rather than chasing the highest number. Keep a sustainable training routine and use comparable measurements to review progress. Ask a qualified professional about changes that need individual guidance. Avoid manipulating food or hydration just before testing to create a score that is harder to compare.
Keep your progress in one photo history
GainFrame is our iPhone app for progress photos and estimated body-composition trends. Free download with limited check-ins. Optional Pro subscription; current price and limits are shown in the app. Photo estimates cannot verify a scan or diagnose a health condition.
Get GainFrame for iPhone