
Quick answer: Commonly cited survey data puts the average American man somewhere around 23 to 28 percent body fat depending on age. Category charts run leaner: athletic 6-13%, fitness 14-17%, average 18-24%, obese 25%+. The typical man therefore measures at or above the chart's obese line - average describes what is common, and healthy describes what physiology rewards.
Your smart scale says 24%, and you have no idea whether that's a problem. One chart online says you're average. Another implies you're one bad month from obese. And half the numbers you've absorbed from fitness content - 10%, 12%, "shredded at 8" - describe a population of physique competitors, not men with jobs.
This page gives you the men-specific numbers: what the average man actually measures, what the category ranges mean, where men store the fat, and what specific percentages look like on a male body. For the decade-by-decade tables covering both sexes, our average body fat by age guide has them; for level-by-level reference photos across the whole 10-40% span, the body fat percentage chart walks every range. This page is the male-first version of both. Women get their own math - the women's version of this page covers it.
What is the average body fat percentage for men?
Commonly cited figures from national health survey data put the average American man somewhere around 23 to 28 percent body fat, depending on the decade of life - roughly 23 to 25 percent for men in their 20s, drifting toward 28 to 30 percent by the 60s. The by-age guide breaks that out decade by decade, so this page won't repeat the table.
Here's the part that confuses almost everyone: the band that category charts label "average" for men is 18 to 24 percent, and the actual population average sits at the top of it or past it. Both numbers are legitimate. The chart band comes from older body-composition classification tables, and the survey average describes a population that has gotten heavier since those tables were drawn.
The practical translation: a man at 20 percent is inside the chart's average band while measuring leaner than the majority of American men. A man at 26 percent is close to the true population average while sitting past the 25 percent threshold where men's charts commonly flag elevated risk. "Average" is doing two jobs in this topic, and knowing which one a chart means saves you a lot of misplaced worry - or false comfort.
What are the healthy body fat ranges for men?
The commonly cited men's categories:
| Category | Men's body fat | What it means |
|---|---|---|
| Essential fat | 2-5% | The minimum for basic function. Competition-day leanness; unsustainable and commonly disruptive to hormones and energy. |
| Athletic | 6-13% | Visible abs and clear muscle definition. Typical of competitive athletes; takes deliberate work to hold. |
| Fitness | 14-17% | The "fit" look - flat stomach, some definition in good lighting, no ab outline at rest. Compatible with normal life. |
| Average / acceptable | 18-24% | Soft midsection, little visible definition. Common and within acceptable health guidance. |
| Elevated / obese | 25%+ | Risk markers climb, and fat increasingly concentrates at the belly as levels rise. |
Two notes on reading this table. First, the floor is real: essential fat near 2 to 5 percent is stage-condition territory, and holding it costs hormones, strength, and mood long before it costs anything aesthetic. The leanness fitness media treats as a default - single digits, year round - is rare among natural lifters and rarer still among men who also want to feel good. Our natty limit guide covers what sustained leanness realistically looks like without pharmacology.
Second, the boundaries are softer than they look. Measurement methods disagree by several points on the same man, and where you personally look and feel best within a range is individual. If your reading lands within a couple of points of a boundary, you effectively straddle it.
Why does the average man measure above the healthy range?
Two forces push the population average up and to the right, and neither is mysterious.
The first is plain fat gain: commonly cited survey trends show the average man getting heavier decade over decade, and most of that added weight is fat. The second is quieter - muscle loss. From roughly the 30s onward, men who don't strength train commonly lose a few percent of muscle mass per decade. Body fat percentage is a ratio, so a shrinking lean side pushes the number up even at a stable scale weight. A man who weighs the same at 45 as he did at 25 has commonly still drifted several points fatter.
That's also why "average" drifts with age while "healthy" barely moves. The by-age averages climb about a point per decade; the healthy ranges stay put, because physiology doesn't renegotiate. Strength training attacks the drift from both directions - it holds the muscle that keeps the denominator honest, and it's the reason trained men in their 50s commonly measure leaner than untrained men in their 20s.
Where do men store fat, and why does it matter?
Male fat storage is belly-first. Testosterone-influenced distribution directs fat toward the midsection - both the subcutaneous layer you can pinch and the visceral fat packed around the organs underneath. This is the apple pattern, and it's why a man can carry relatively lean arms and legs over a 40-inch waist.
That pattern is the unlucky half of the male deal. Visceral fat is commonly reported in the research as the metabolically harmful kind - the driver behind the waist-circumference thresholds health guidance leans on. Our visceral fat guide goes deeper; the short version is that where men store fat is riskier per pound than where women store it, which is part of why men's risk flags trigger at lower body fat percentages.
The tracking consequence is actually convenient: because male fat concentrates at the waist, a tape at the navel is an unusually efficient proxy for a man's body fat trend. If the waist is shrinking, the percentage is almost certainly falling - the average waist size guide covers the thresholds and the measurement protocol.
What do 18%, 23%, and 28% body fat look like on a man?
Numbers only help if you can picture them. These are standardized, photorealistic AI renders from our body fat visualizer - same build, pose, and lighting, so body fat level is the only thing changing between images.
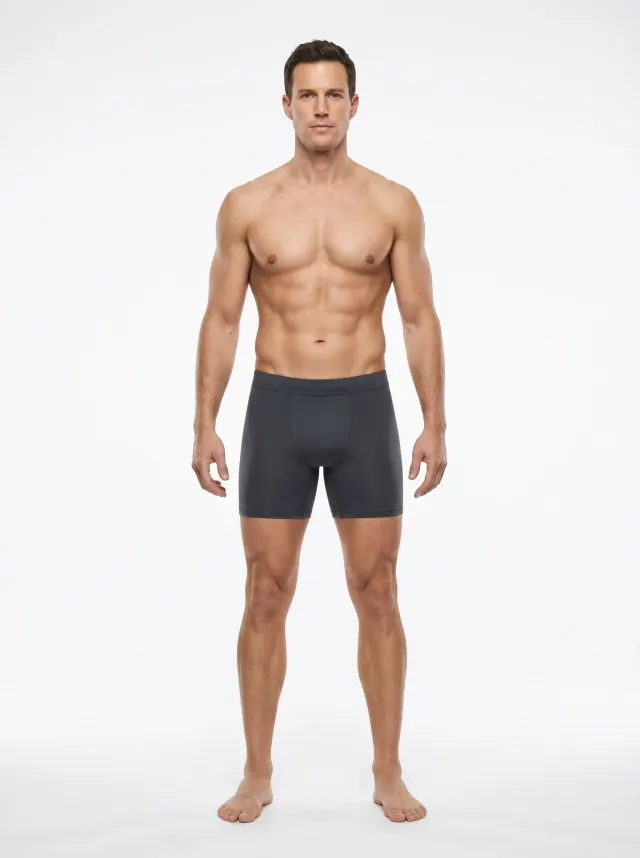
18% - the border of the fitness and average bands. Flat stomach, definition in good lighting, no ab outline at rest. Leaner than most American men measure.
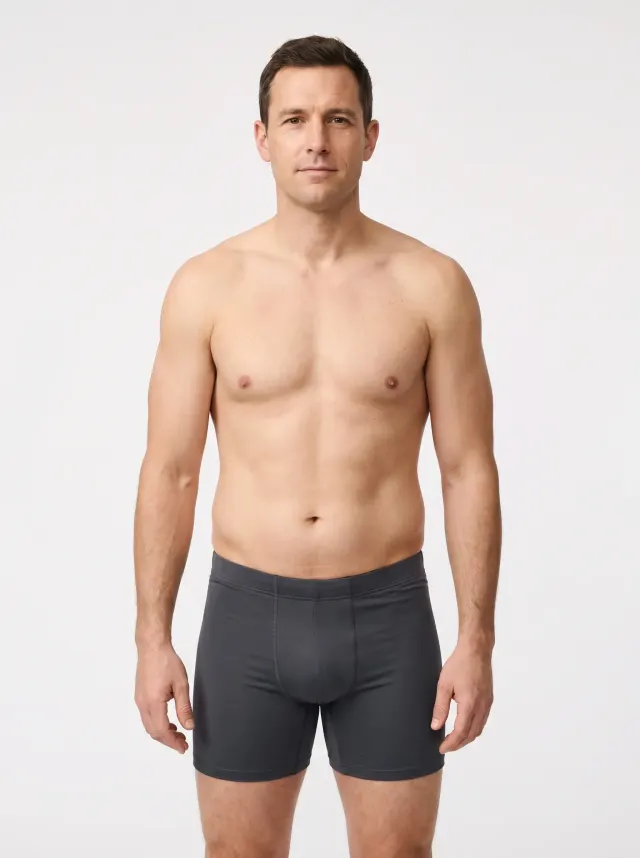
23% - the top of the chart's average band and close to the commonly cited survey average for younger men. Soft midsection, fat carried mostly at the belly, little visible definition.
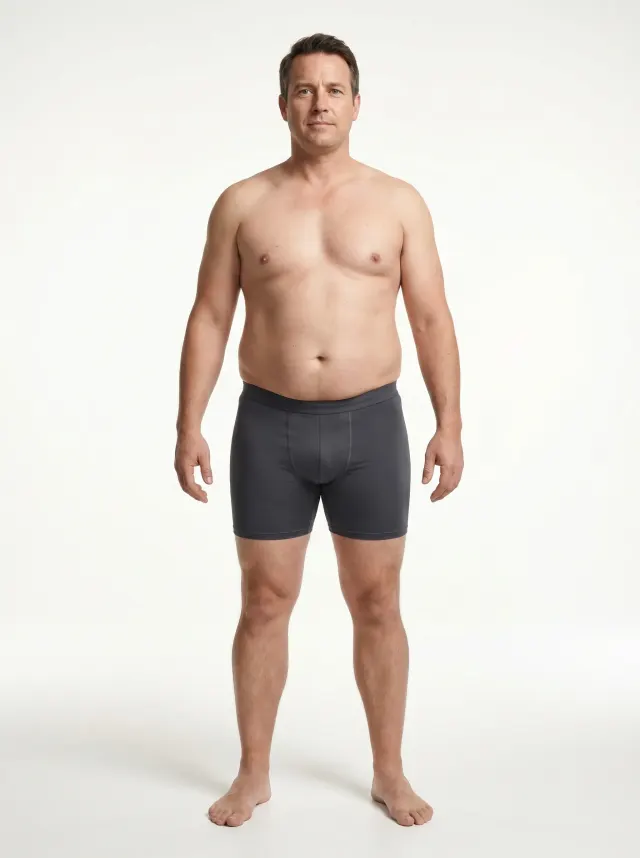
28% - past the 25% line men's charts commonly flag, and close to what many middle-aged American men measure. The honest read is common and worth addressing, at a sane pace.
Worth noticing: the jump from 18 to 23 softens definition more than it changes size, while the jump from 23 to 28 adds size - almost all of it at the waistline. Five points means something different depending on where you start, and on a man, the belly absorbs most of the change.
For a single-level deep dive, the body fat picture gallery has a reference page per level - 18% body fat on a man and 25% bracket the averages this page covers.
Should you aim for average or for healthy?
Average is a description, not a target. The useful target for most men is the fitness band - 14 to 17 percent - because it's where health markers, sustainable effort, and looking like you train all overlap. The dad bod range at 20 to 25 percent is commonly one focused 12-16 week cut away from it. Chasing the athletic band is legitimate too; just price it honestly, because single digits cost more to hold than most men expect. Sport-specific reference points live in our athlete body fat guide.
Whatever the target, the measurement problem is the same: scale weight can't see composition, and a man dropping fat while gaining muscle can watch the scale hold still for months. GainFrame estimates body fat percentage from progress photos, along with muscle-group ratings and a physique score, so the trend shows up in one place over time. Estimates from photos rather than clinical measurement, and iOS only - but consistent week to week, which is what trend-tracking needs. For a one-off number today, the free browser body fat estimator runs a single scan a day with no download or signup.
Frequently asked questions
What is the average body fat percentage for a man?
Commonly cited survey data puts the average American man somewhere around 23 to 28 percent body fat, climbing by decade - roughly 23 to 25 percent in the 20s and closer to 30 percent past 60. That sits at the top of the 18 to 24 percent band category charts label average, which says more about the population than about the chart.
What is a healthy body fat percentage for men?
Commonly cited category charts put the fitness range at 14 to 17 percent and the athletic range at 6 to 13 percent, with 18 to 24 percent as average and elevated risk flagged past 25 percent. Essential fat for men is roughly 2 to 5 percent, and holding near it is competition-day territory. Where you feel and perform best within that span is individual.
Is 25% body fat bad for a man?
It's the threshold where men's category charts commonly flag elevated risk, and it's close to what many American men actually measure. Fat at that level increasingly sits at the belly, where visceral accumulation drives most of the health concern. Common and worth addressing are both true - a modest cut toward the 18 to 24 percent band is the standard first move.
Why do men have lower body fat percentages than women?
Essential fat - the minimum needed for basic function - is commonly cited at roughly 2 to 5 percent for men versus 10 to 13 percent for women, largely because of reproductive and hormonal biology. Every category boundary shifts down by a similar amount. A man at 15 percent and a woman at 24 percent are at comparable leanness relative to their sex.
At what body fat percentage do men see abs?
Visible abs typically start appearing around 12 percent body fat for men, with clear definition commonly cited in the 8 to 12 percent range. That's inside the athletic band, below where most men sit, and noticeably below the population average. Lighting, ab muscle thickness, and where you personally store fat can shift the threshold a point or two either way.
Track your number, against the men's ranges
GainFrame estimates body fat percentage, muscle ratings, and a physique score from your progress photos - so you can see where you sit against the men's ranges and watch the trend move. Free to start on iOS.
Download GainFrame Free