
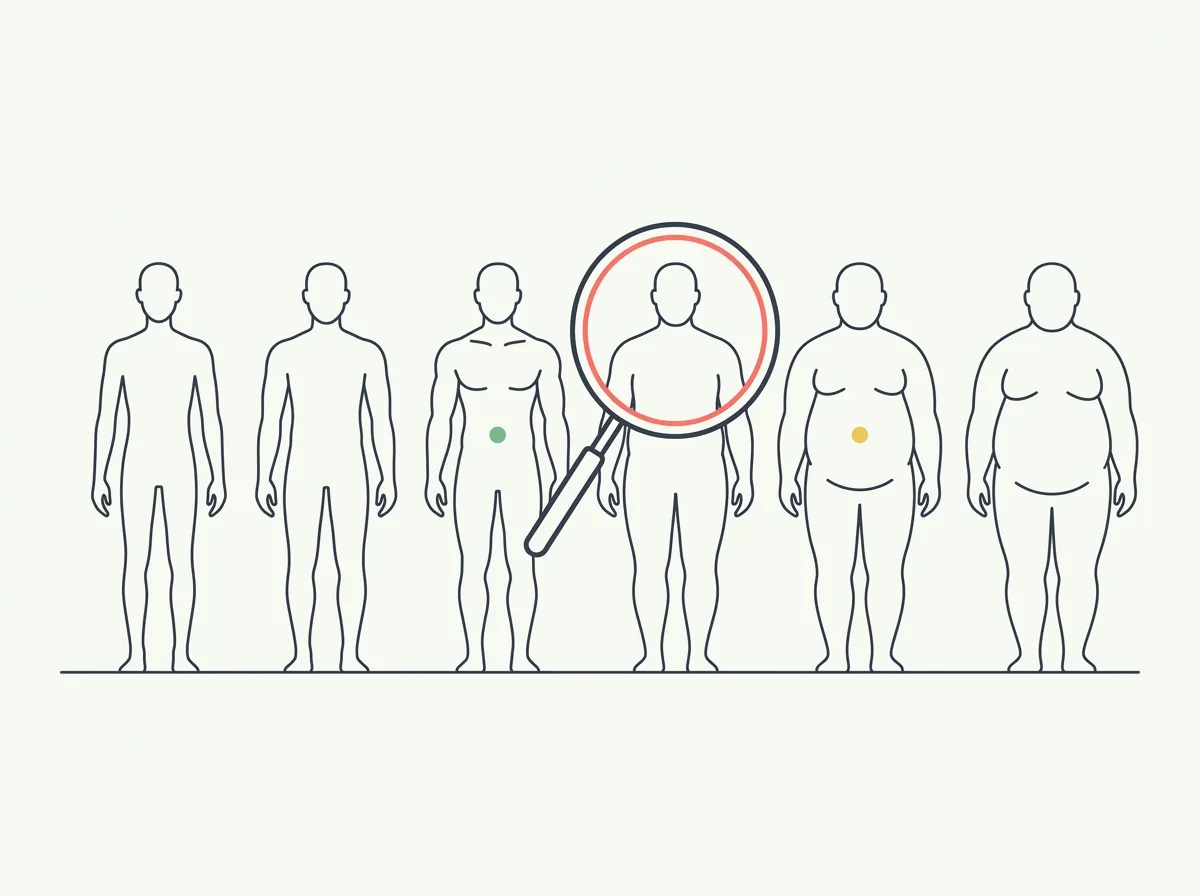
Quick answer: Below are 60 standardized body-composition pictures: sixteen male levels from 8% to 30% and fourteen female levels from 18% to 40%, each shown from the front and back. Because the identity, build, pose, crop, and lighting stay fixed within each sequence, you can compare a relaxed photo against much smaller, more useful steps.
Search for body composition pictures and you get a collage of different strangers: different heights, frames, muscle, tans, lighting, and camera angles, each labeled with a suspiciously confident percentage. Matching yourself against that is guesswork stacked on guesswork.
A useful reference changes one variable at a time. Every picture below is the same rendered body — same build, same pose, same lighting — at a different composition. That control is the whole point of the page.
These are photorealistic AI renders from our body fat visualizer, and the trade-off is stated up front: they show the pattern cleanly, and your own body will express that pattern with its own distribution.
What does each level look like on a man?
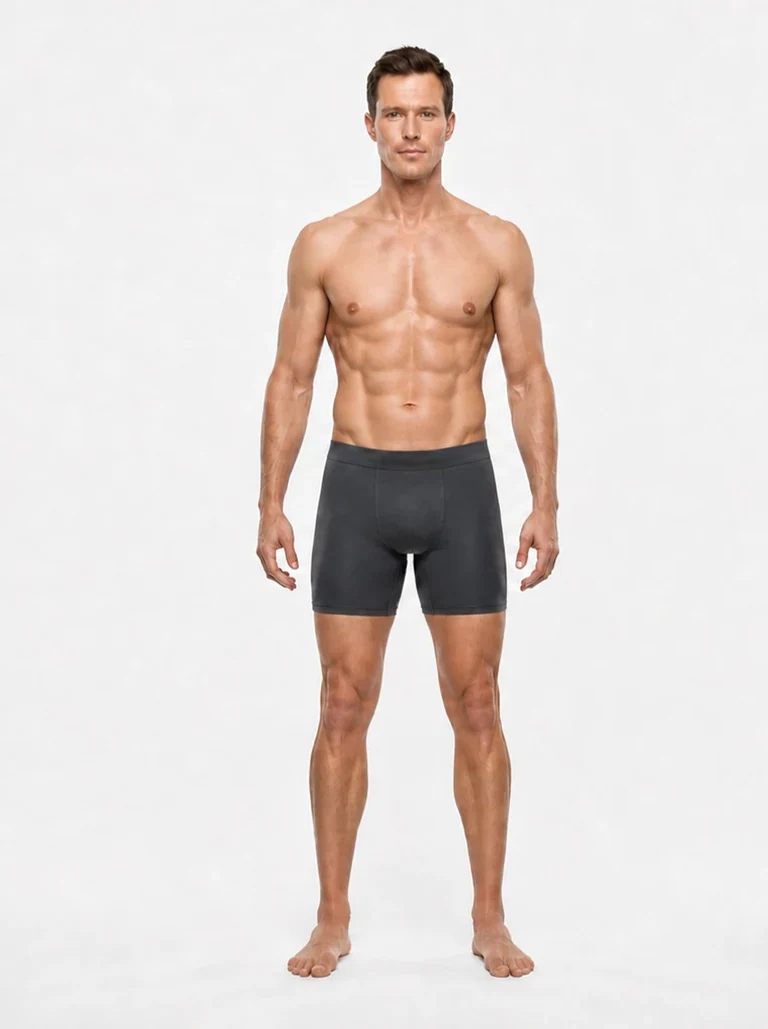
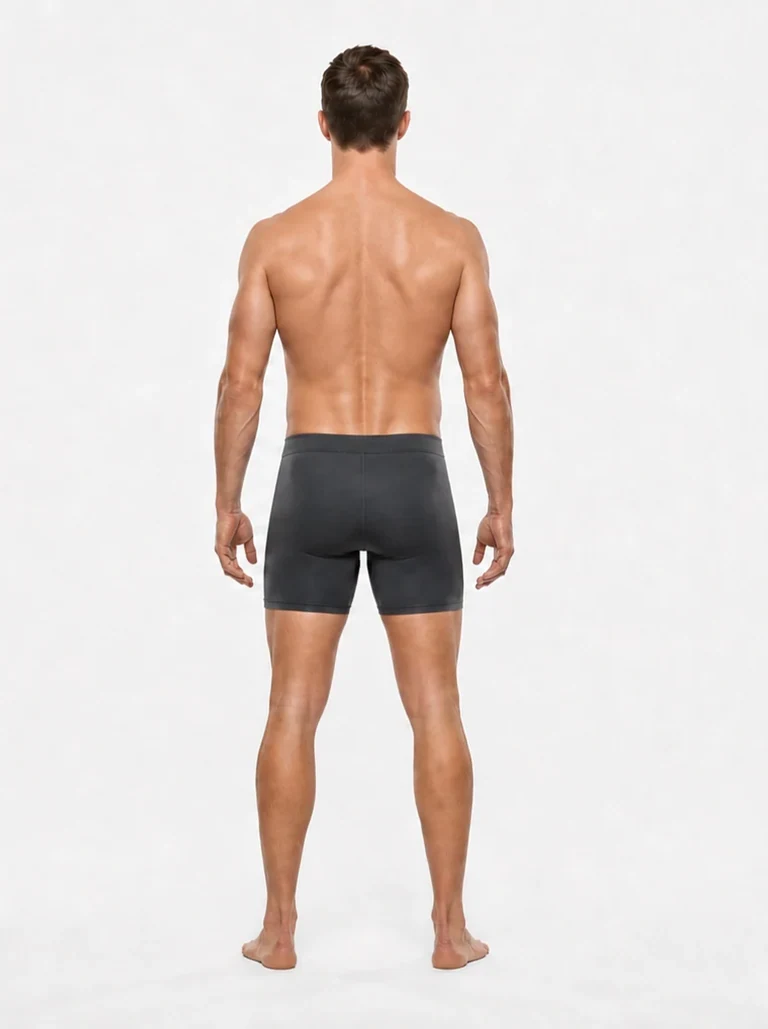
8% — competition-lean. Full ab definition, visible veins, and separation between muscle groups. Hard to hold; commonly a photoshoot or contest number.
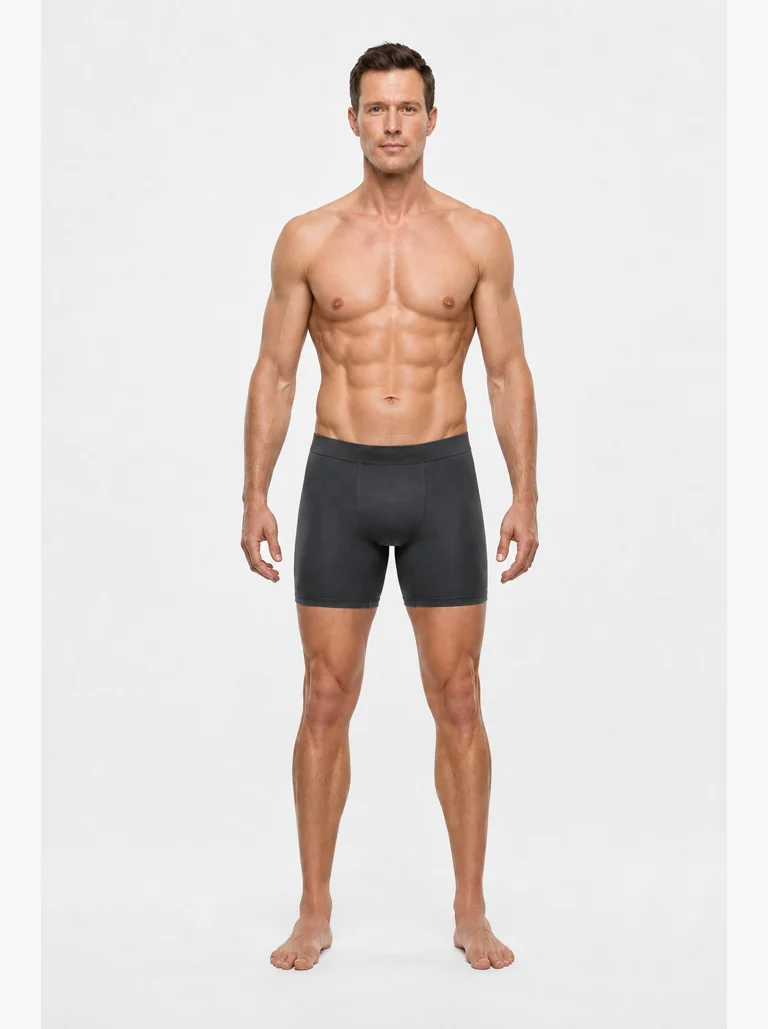
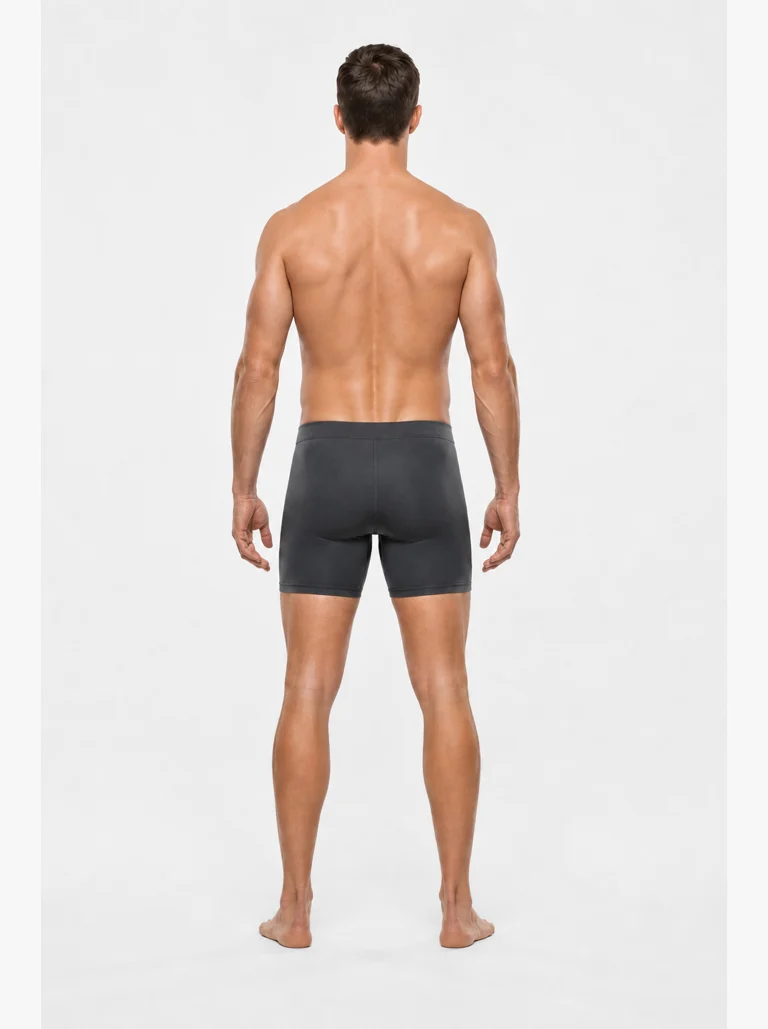
9% — still exceptionally lean, with deep ab definition and a tight waist, but a slightly softer presentation than the stage-lean reference.
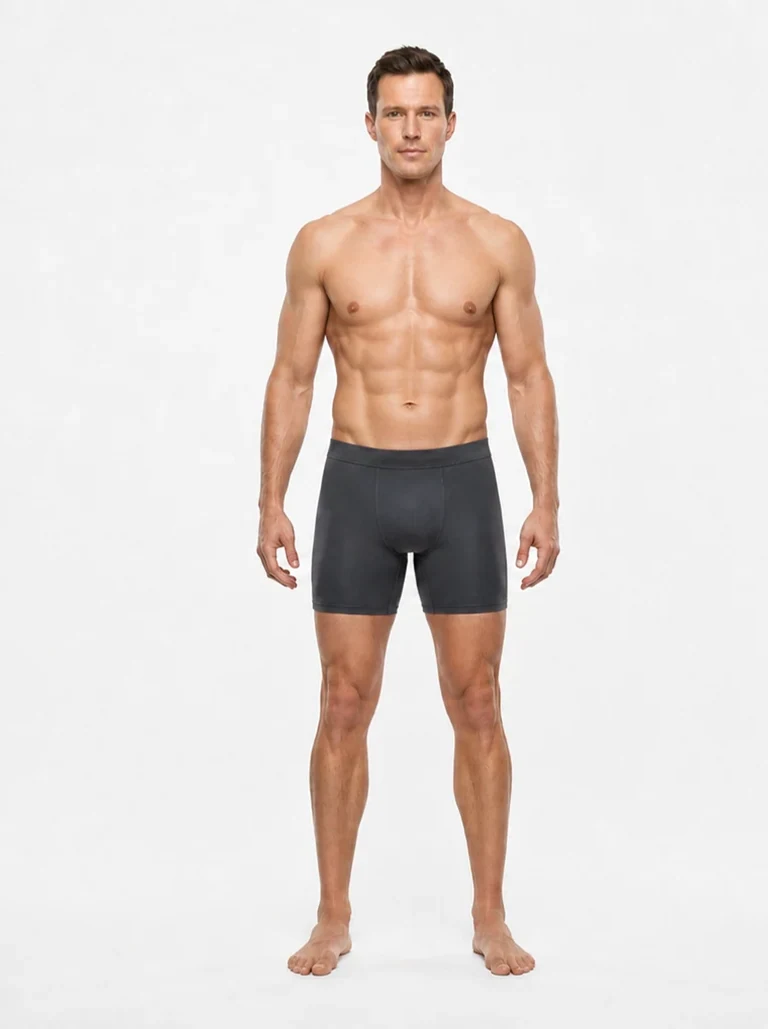
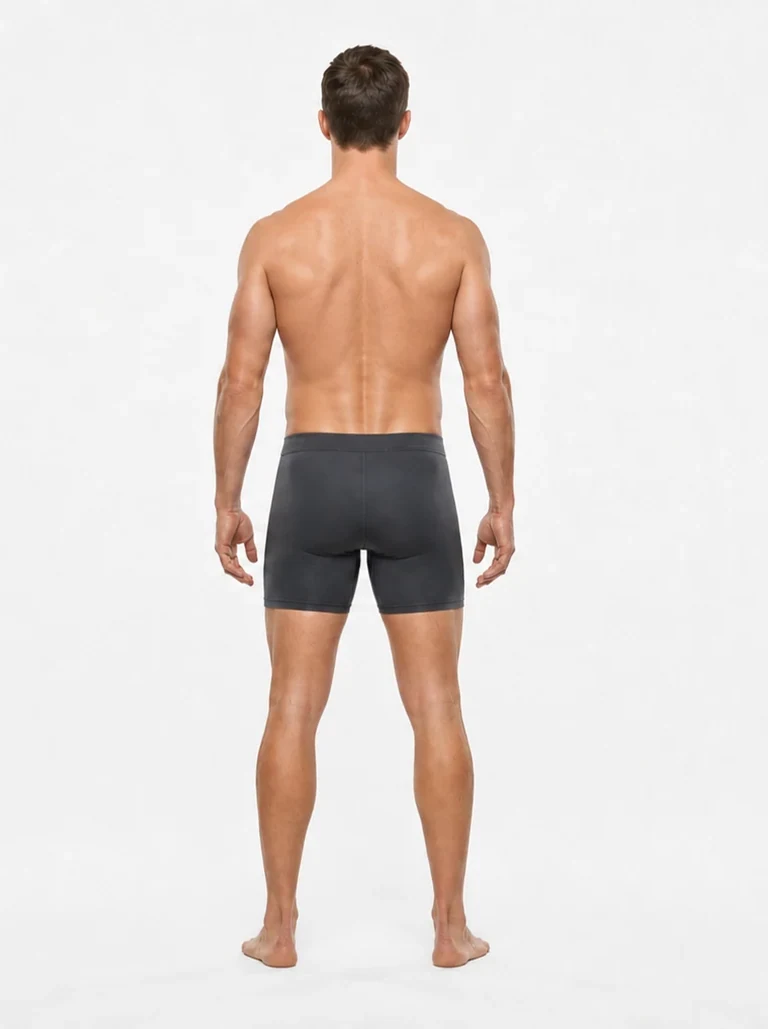
10% — very lean. A clear six-pack remains visible at rest, with a tight waist and strong muscular separation without full stage conditioning.
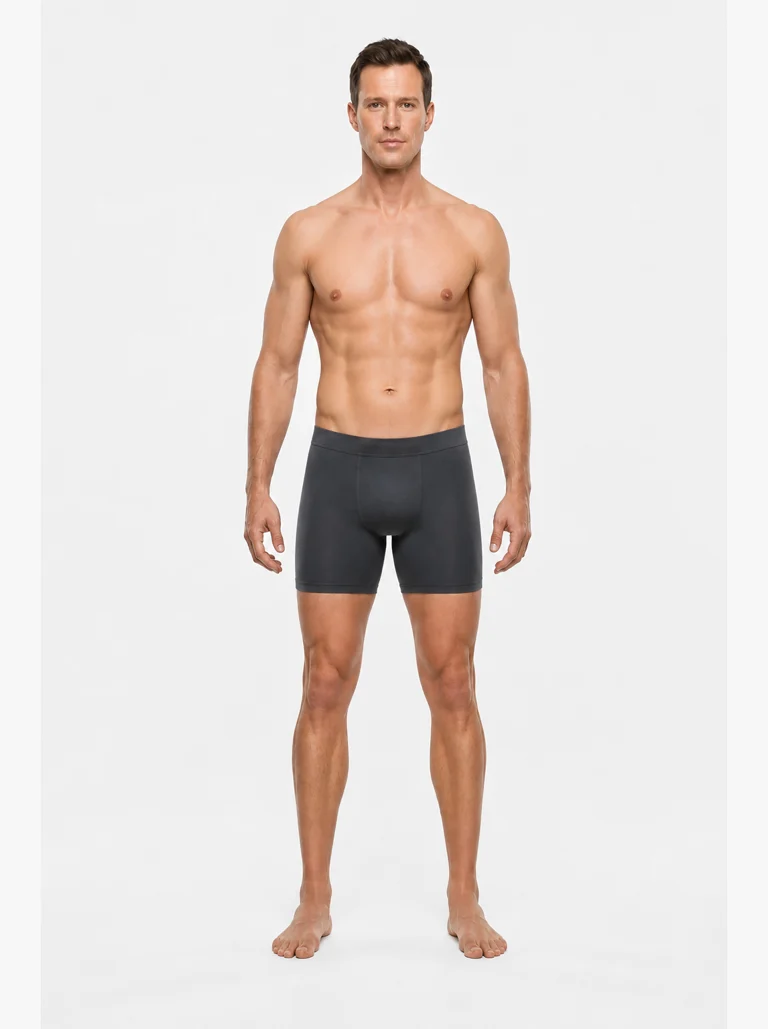
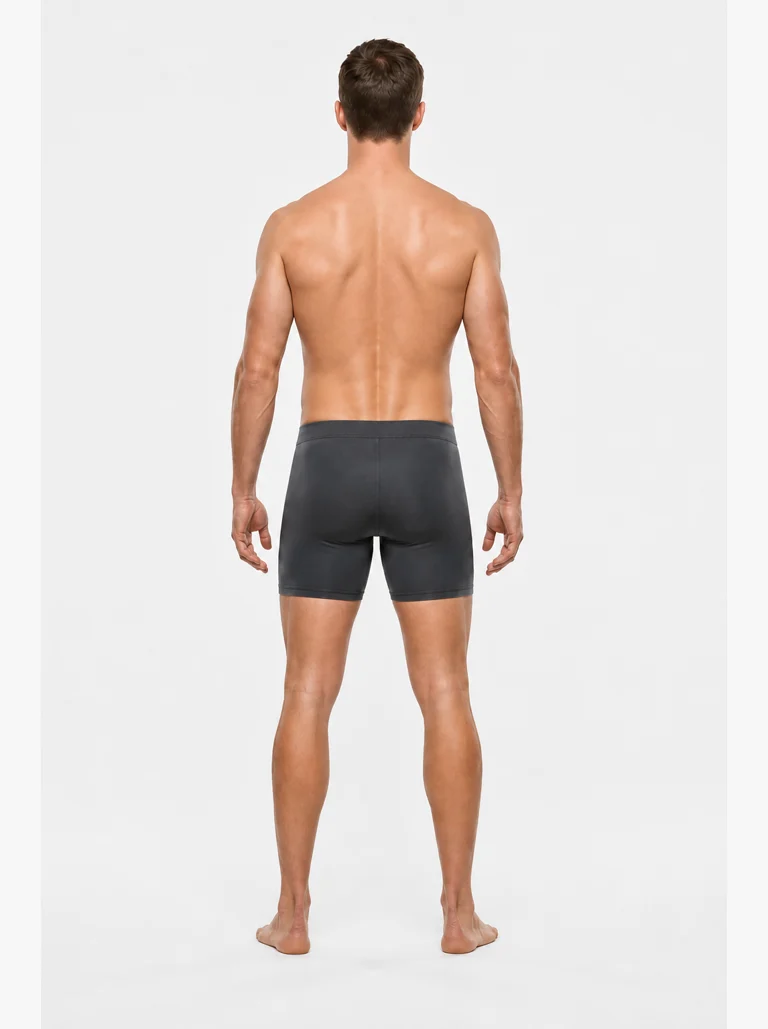
11% — a lean athletic look with strong ab visibility and gradually softened separation through the waist and back.
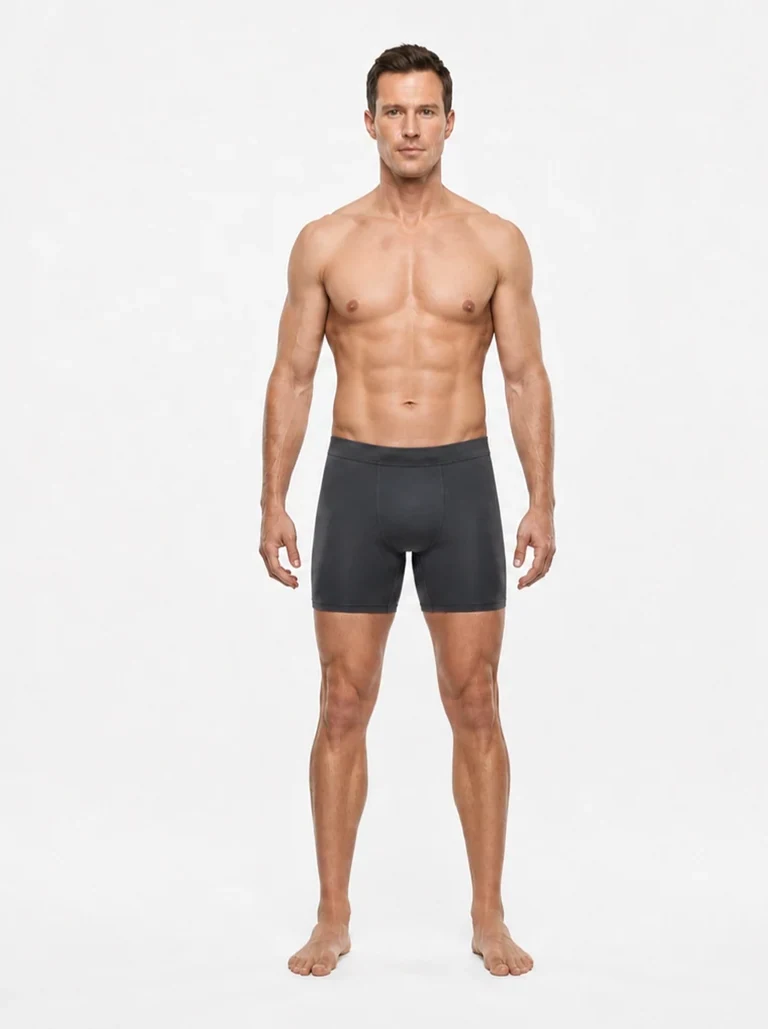
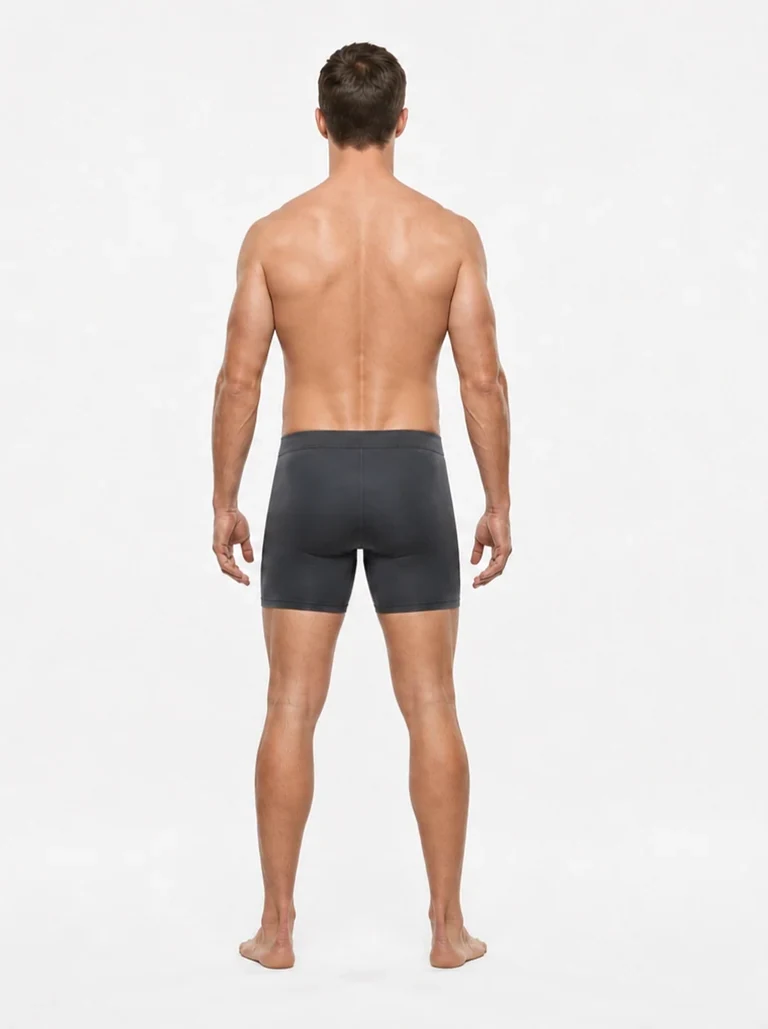
12% — athletic and lean. Abs and muscle separation remain visible, but the face and waist look less depleted than at the single-digit level.
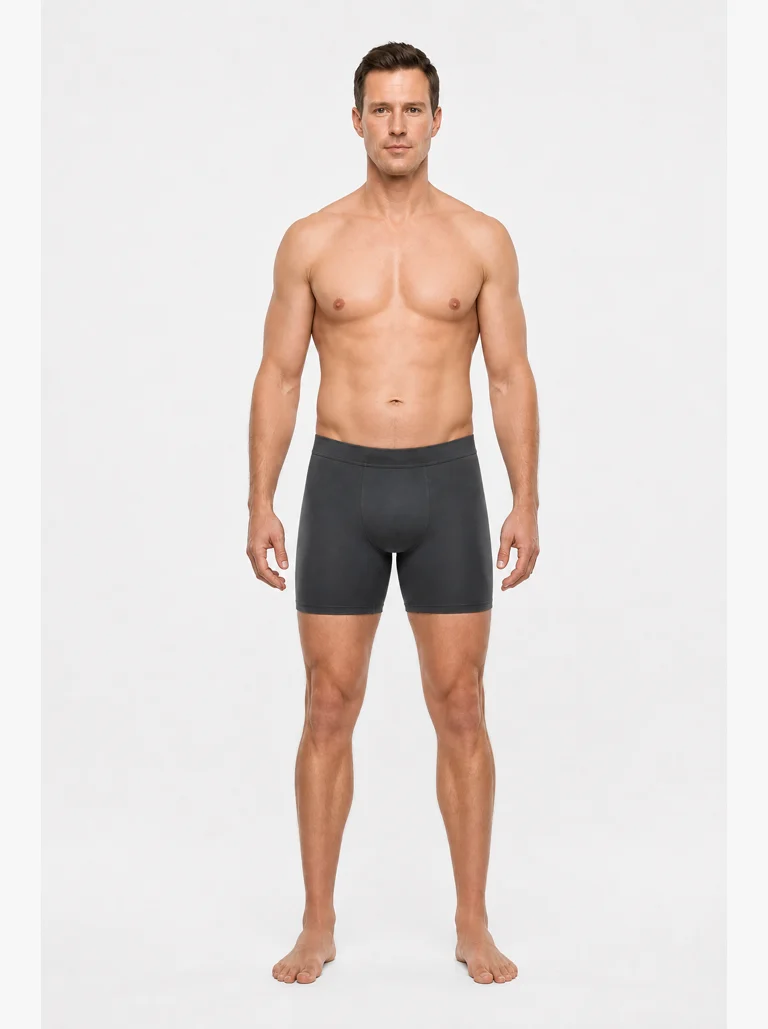
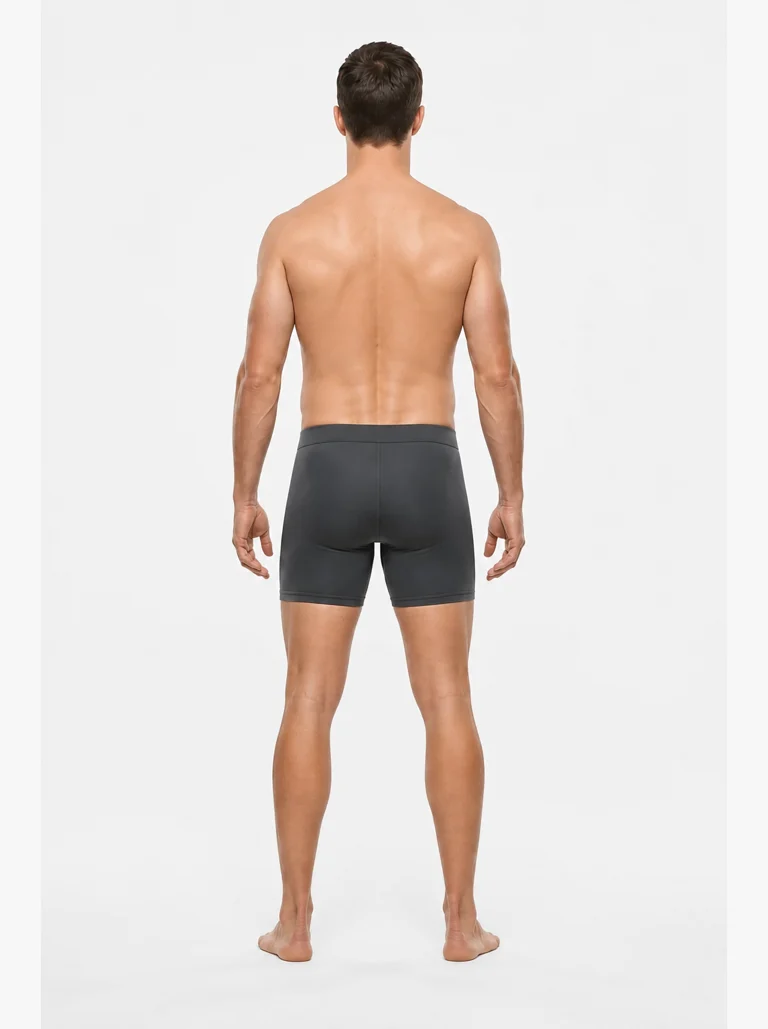
13% — lean and trained, with visible abs and a little more natural softness over the lower torso.
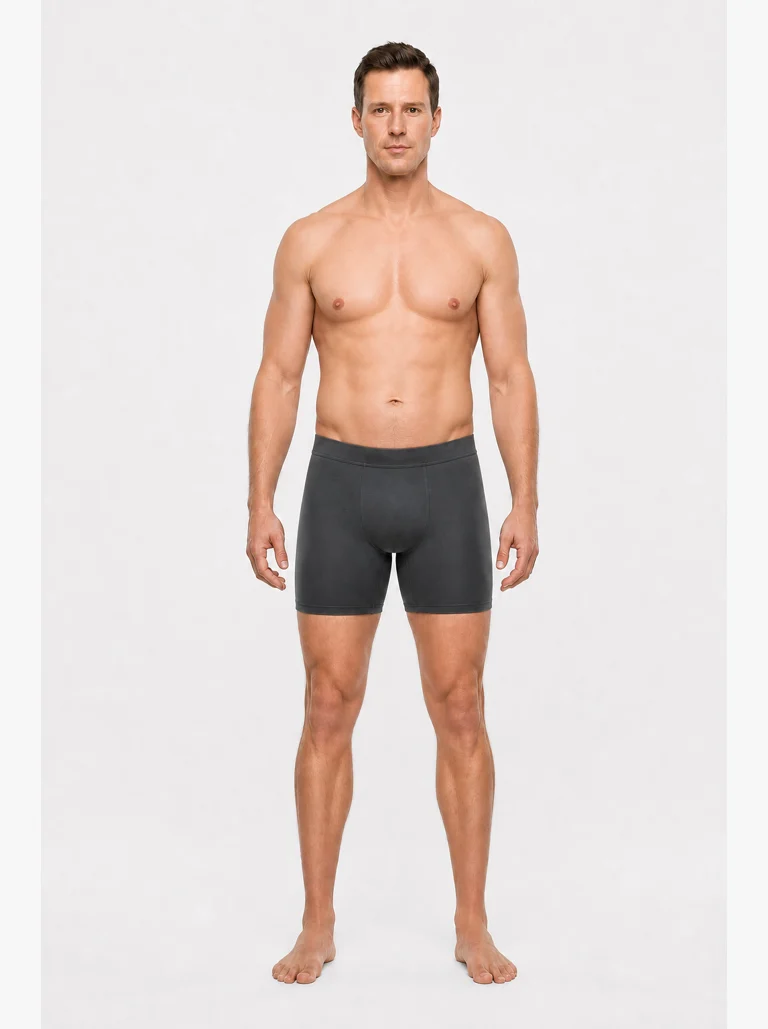
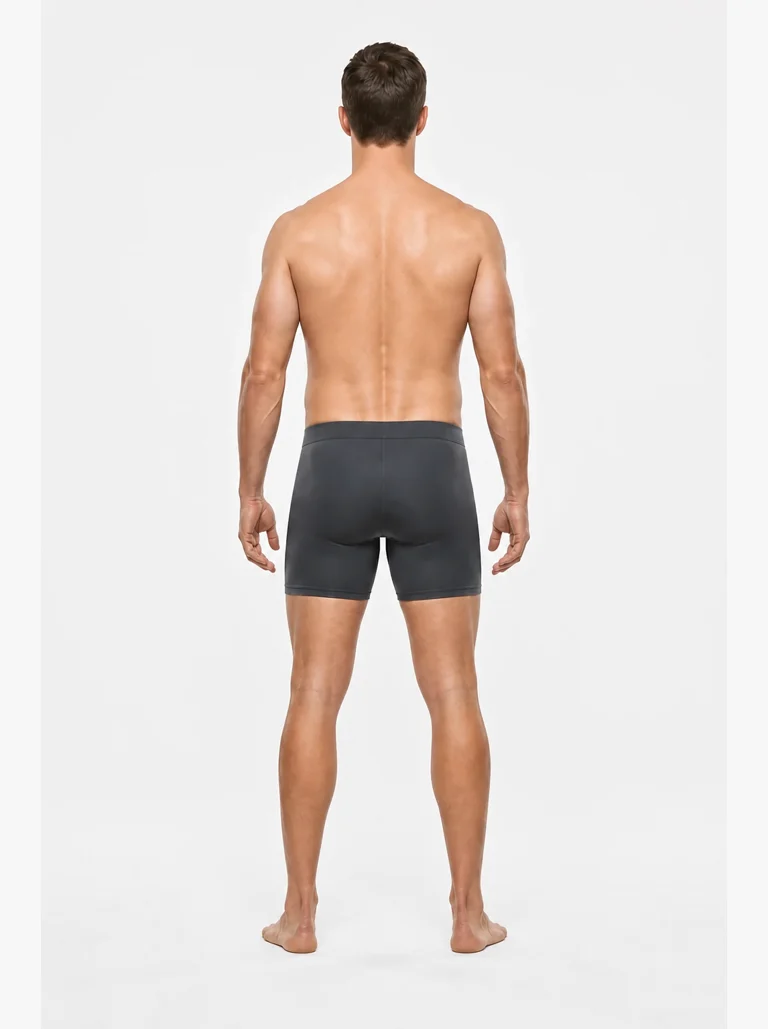
14% — the transition from visibly lean to broadly fit, with upper abs present and softer muscle edges.
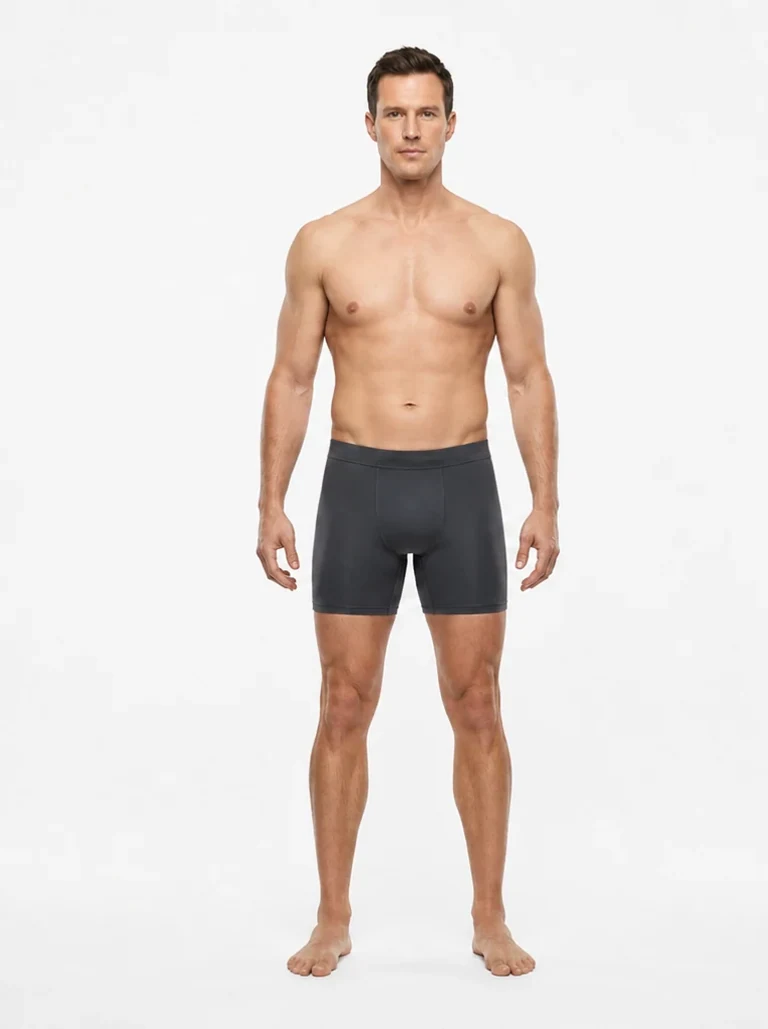
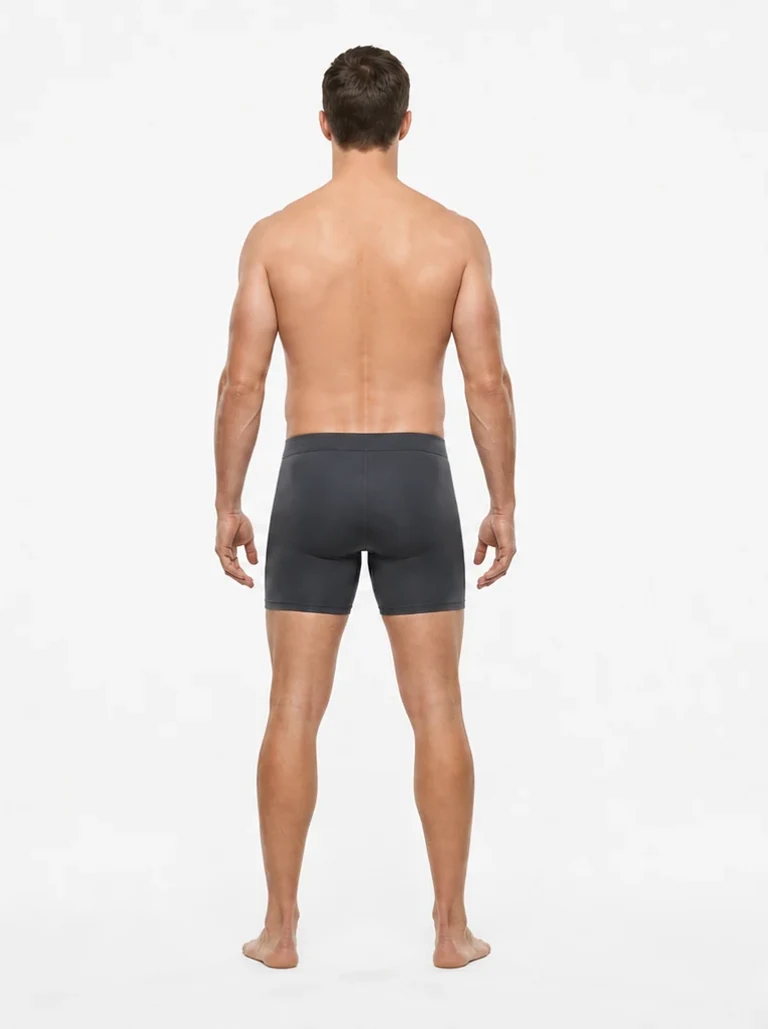
15% — fit and sustainable for many trained men. The waist stays flat, upper abs are faint, and muscle shape is clear without a sharply cut look.
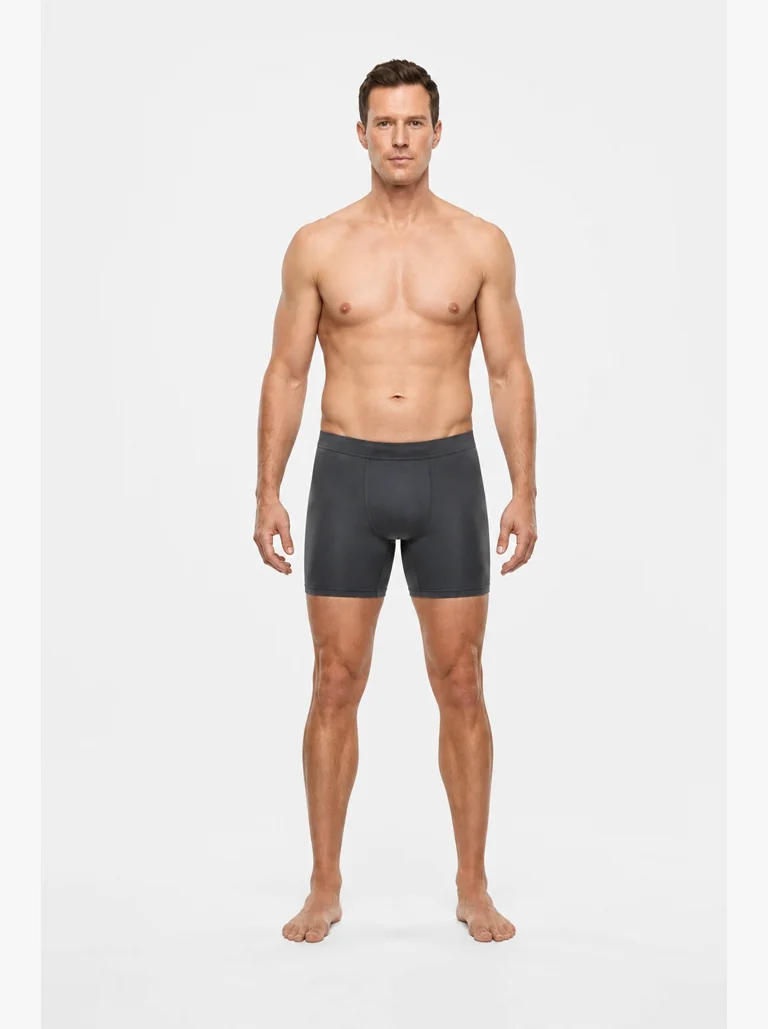
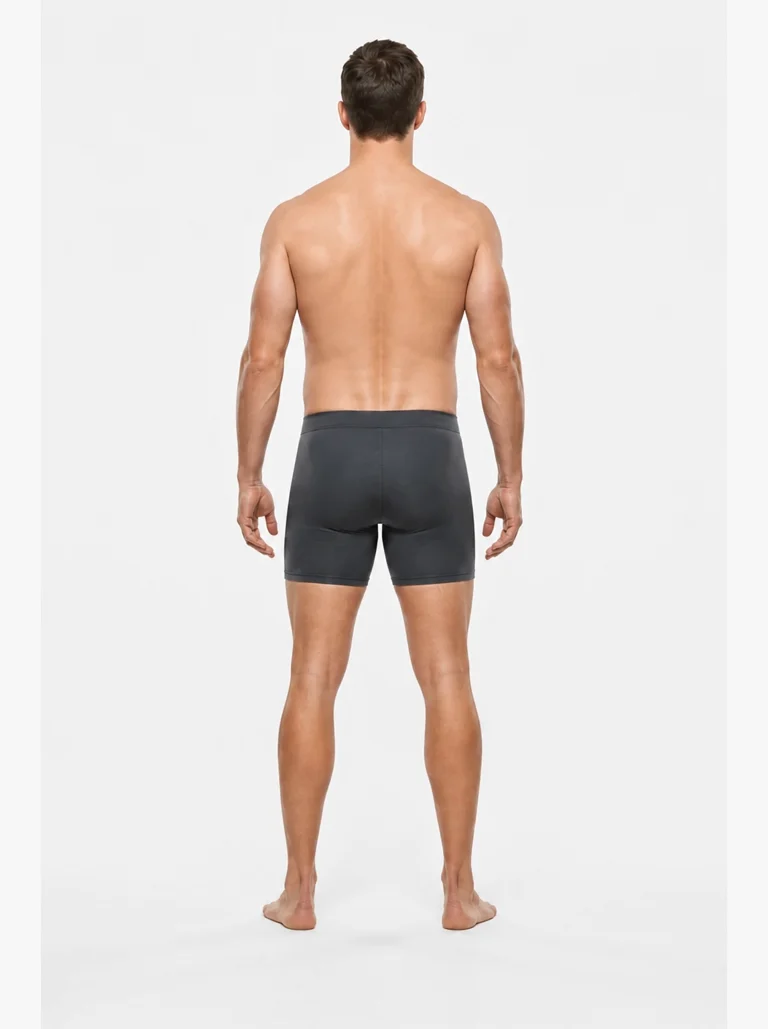
16% — fit with softer definition. Muscle shape stays clear while resting ab visibility begins to fade.
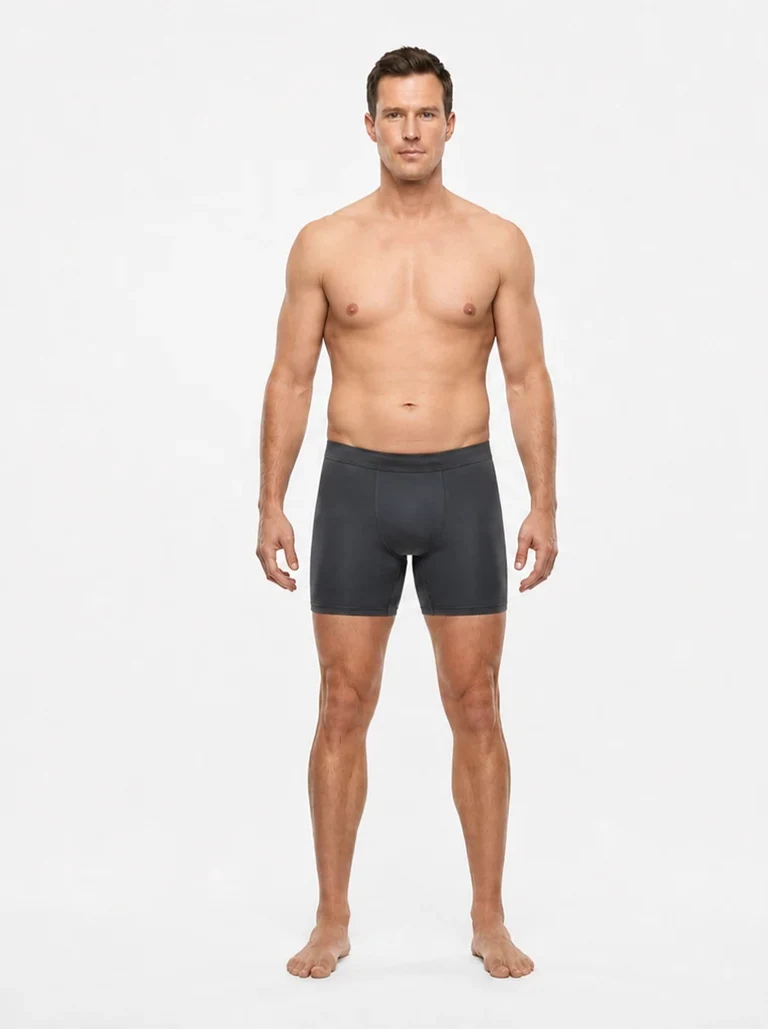
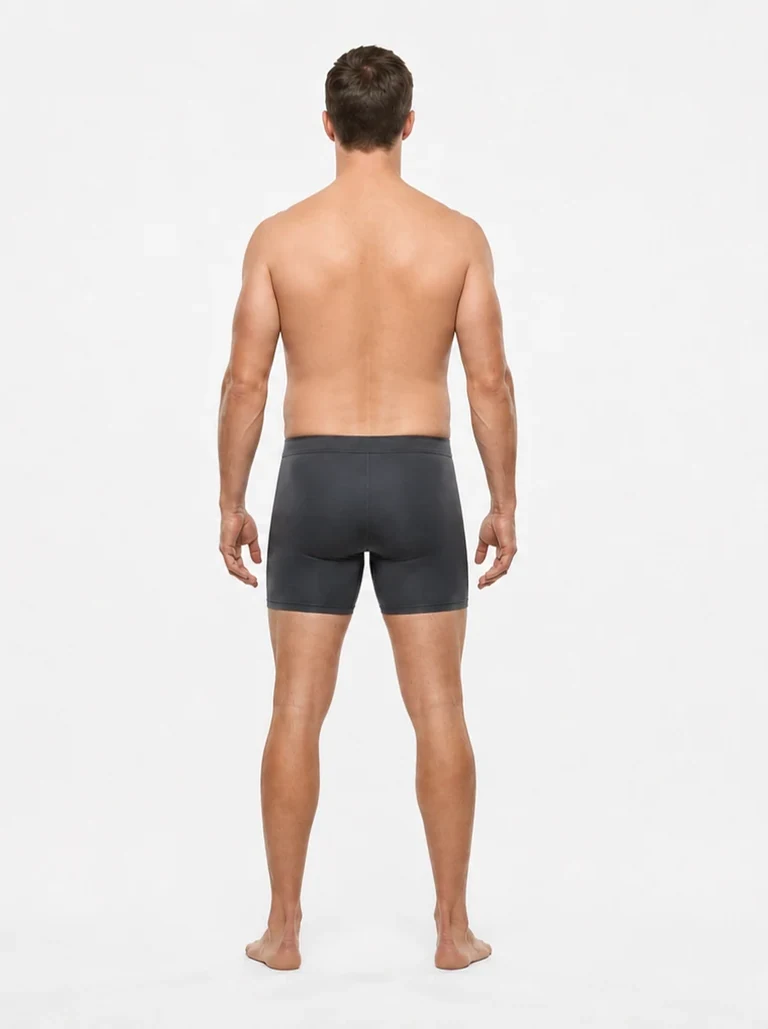
18% — fit-but-soft. Muscle shape shows through while resting ab definition fades and softness begins to collect around the lower waist.
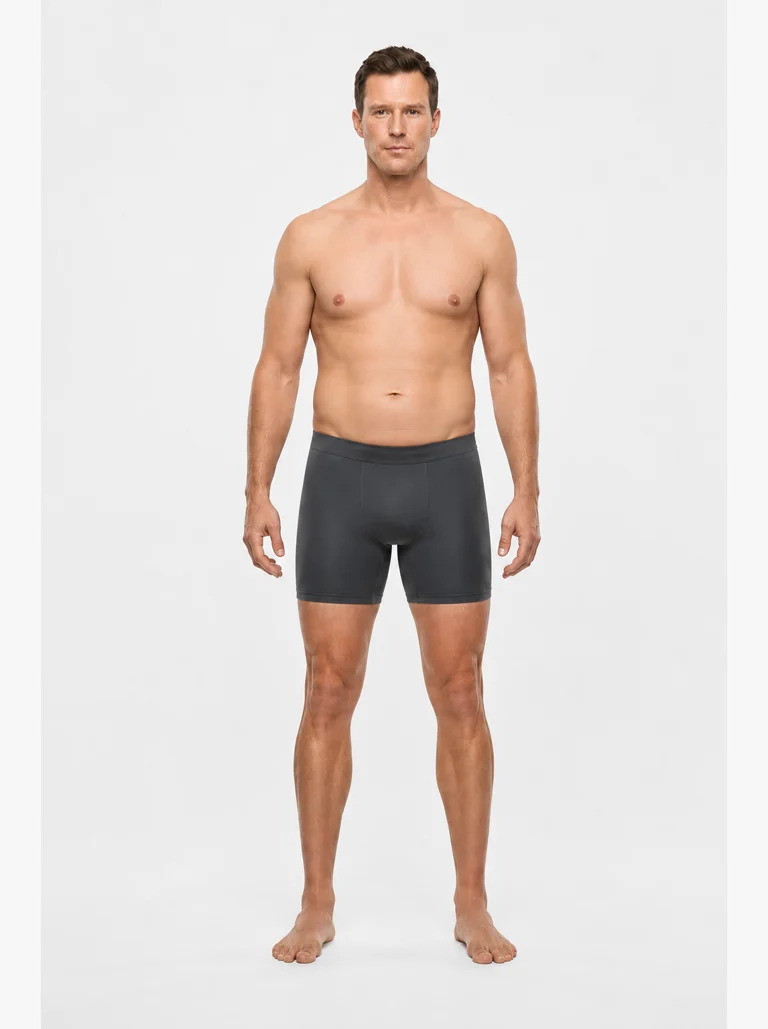
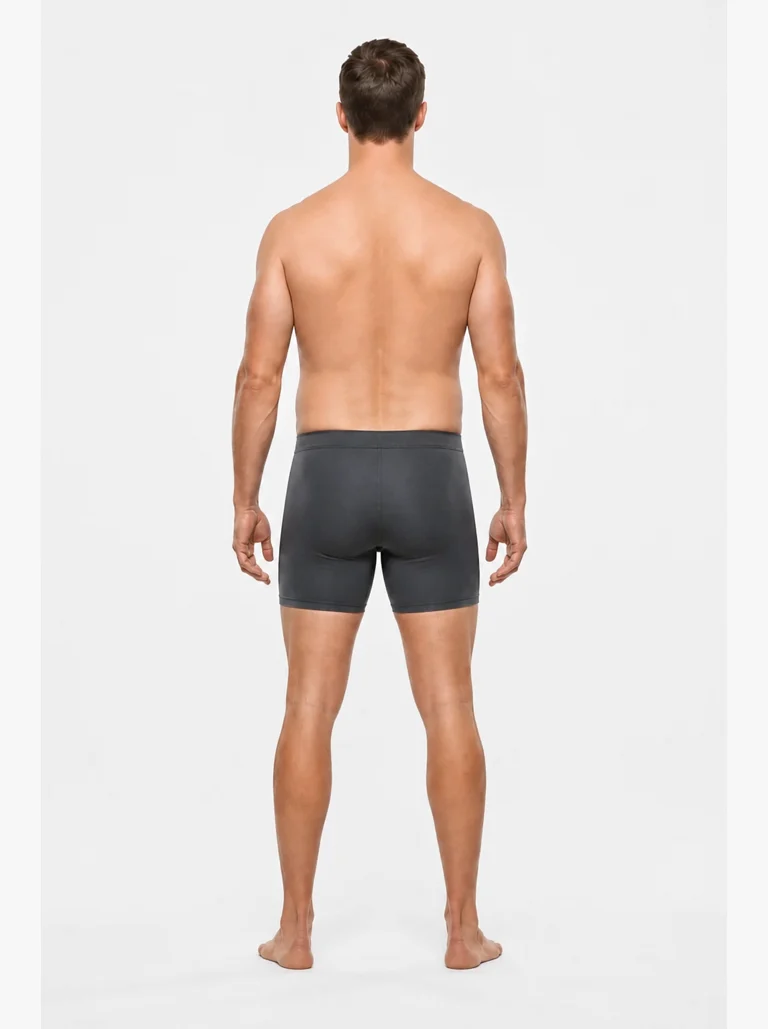
19% — the bridge from fit to average-looking, with a smooth waist and only light muscular separation.
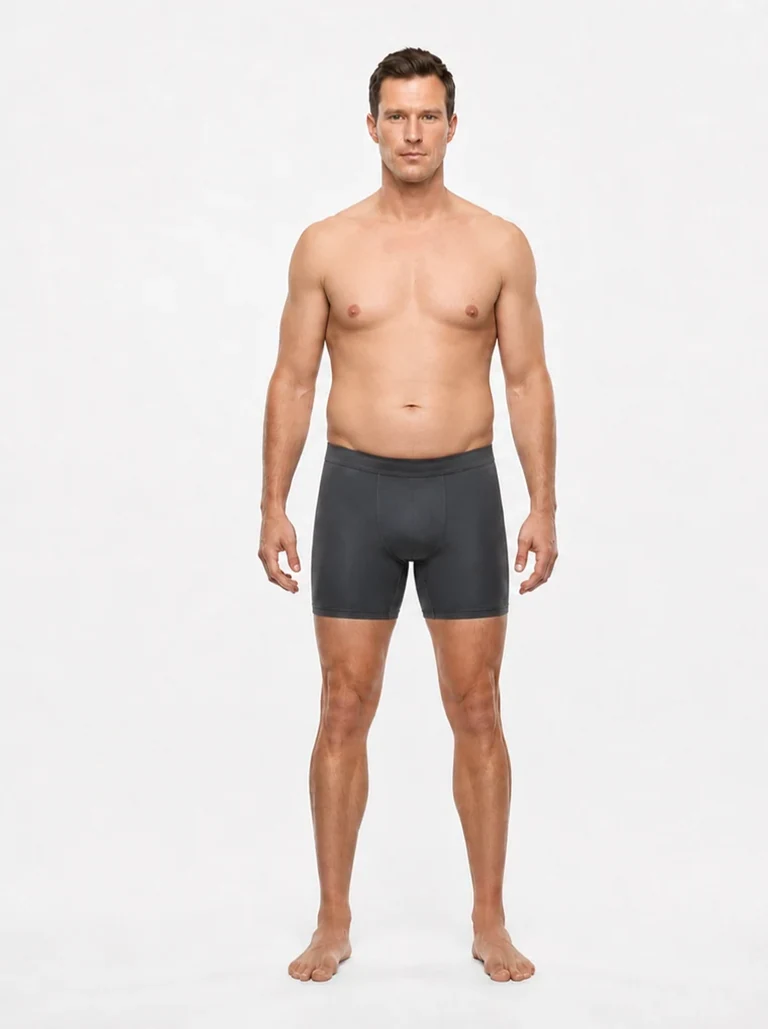
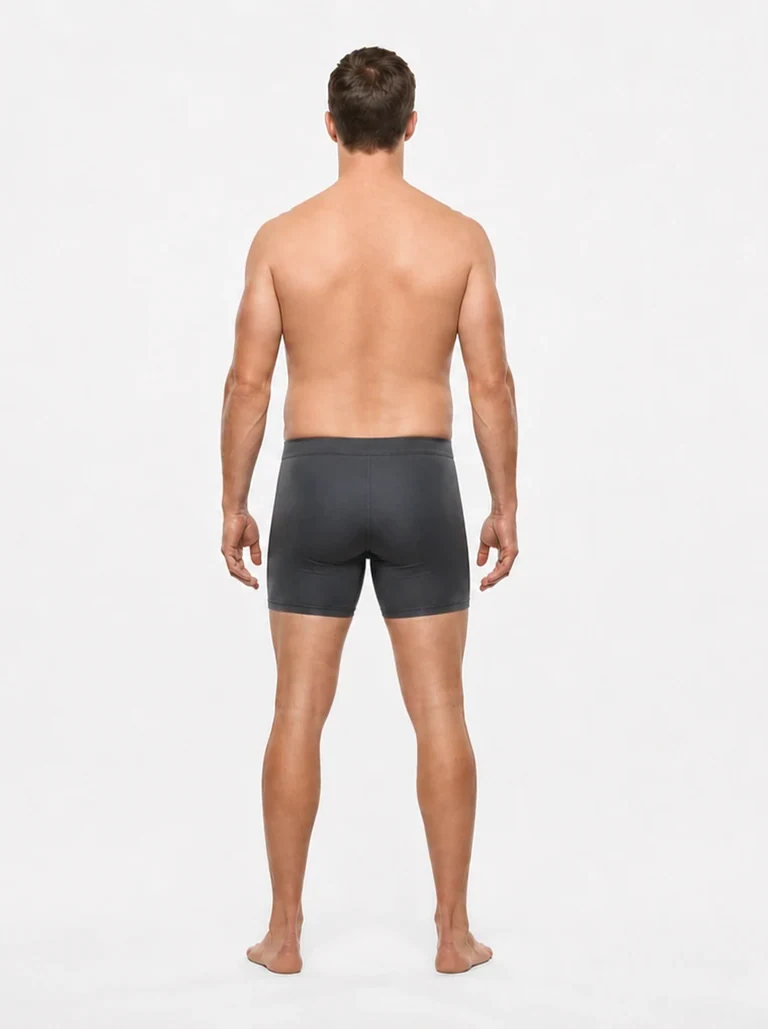
20% — a smooth, average-looking waist with no resting abs. Muscle is still present, but separation is muted from both views.
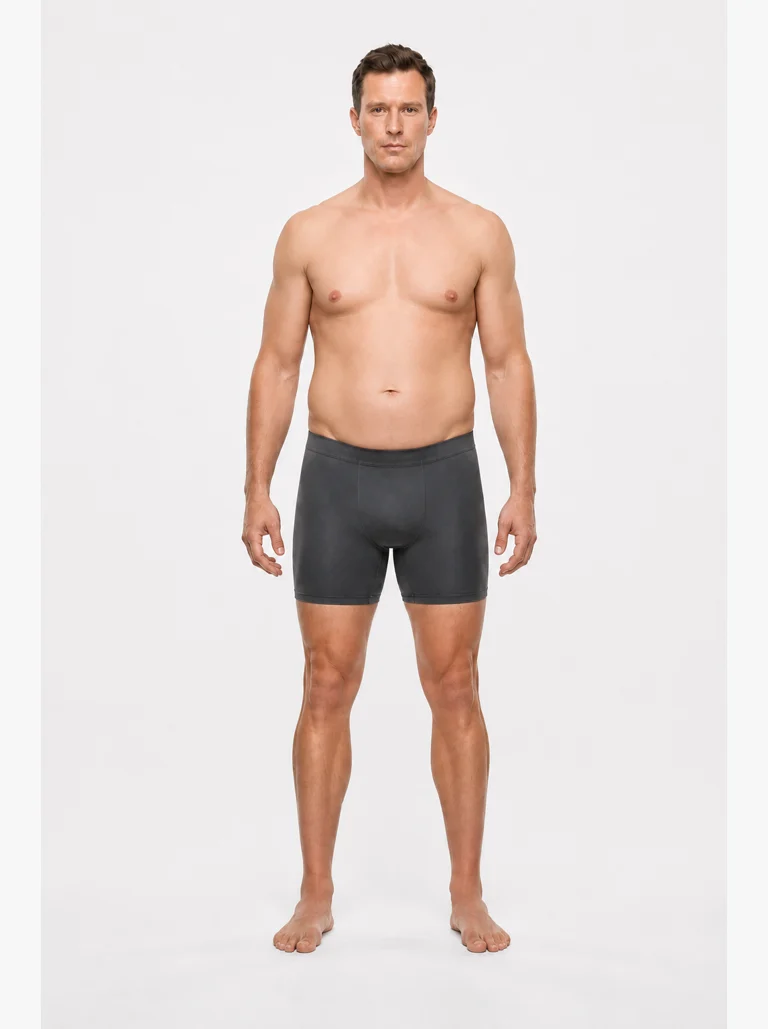
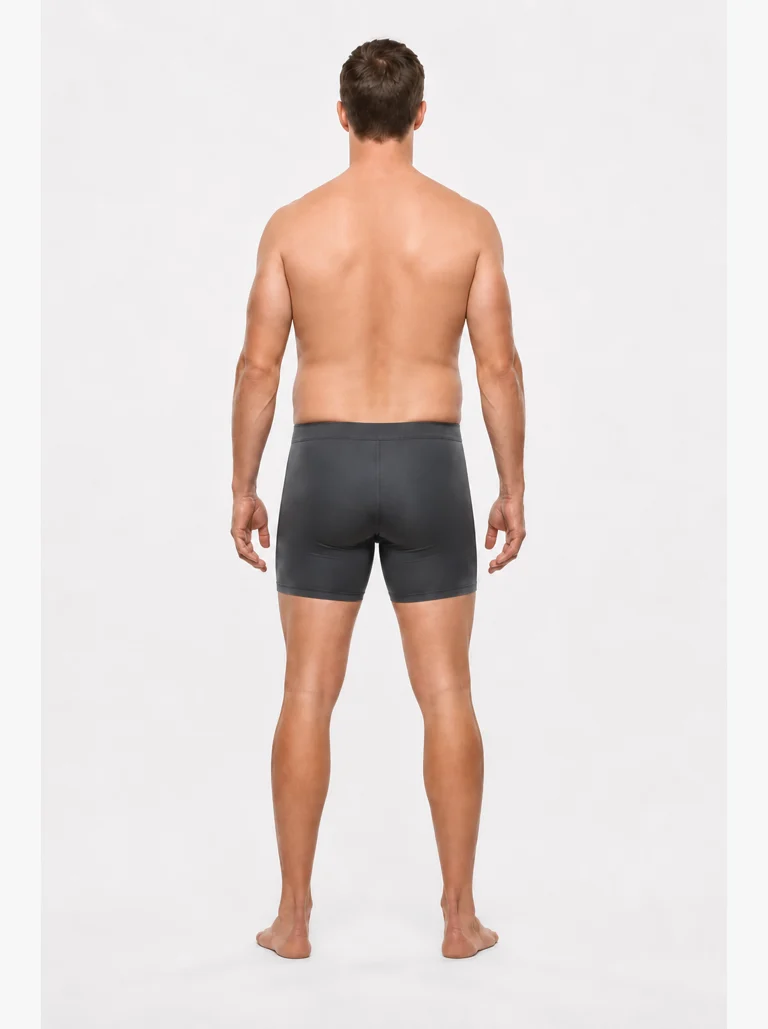
22% — a softer average build, with the midsection broadening and muscle shape increasingly muted.
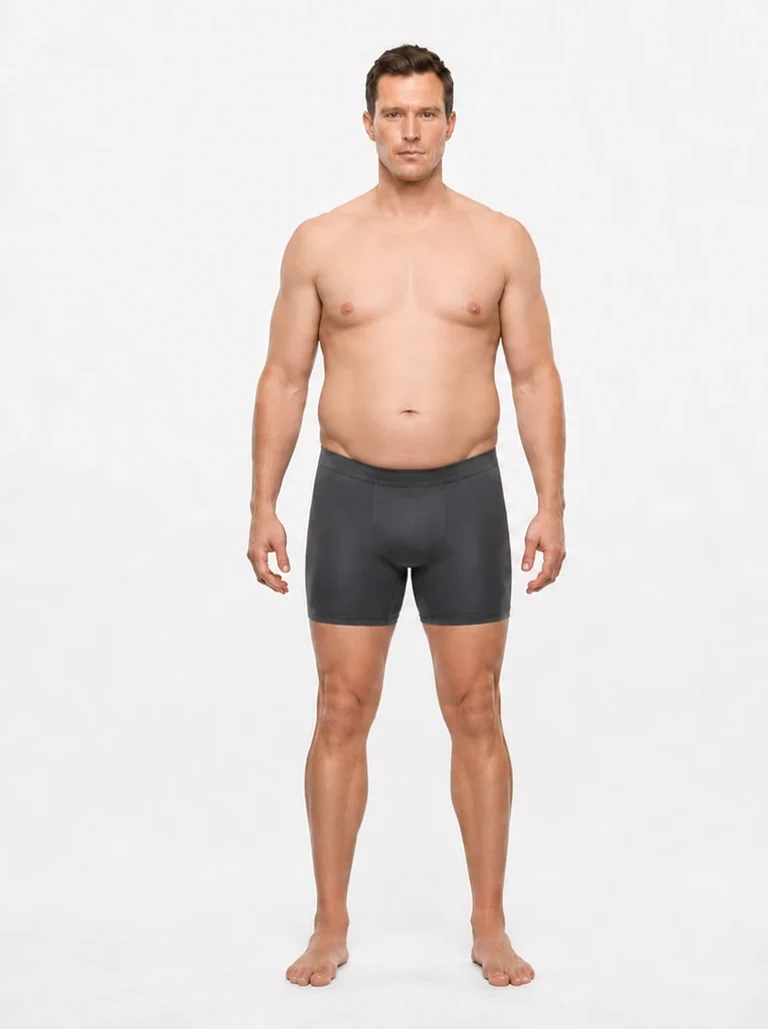
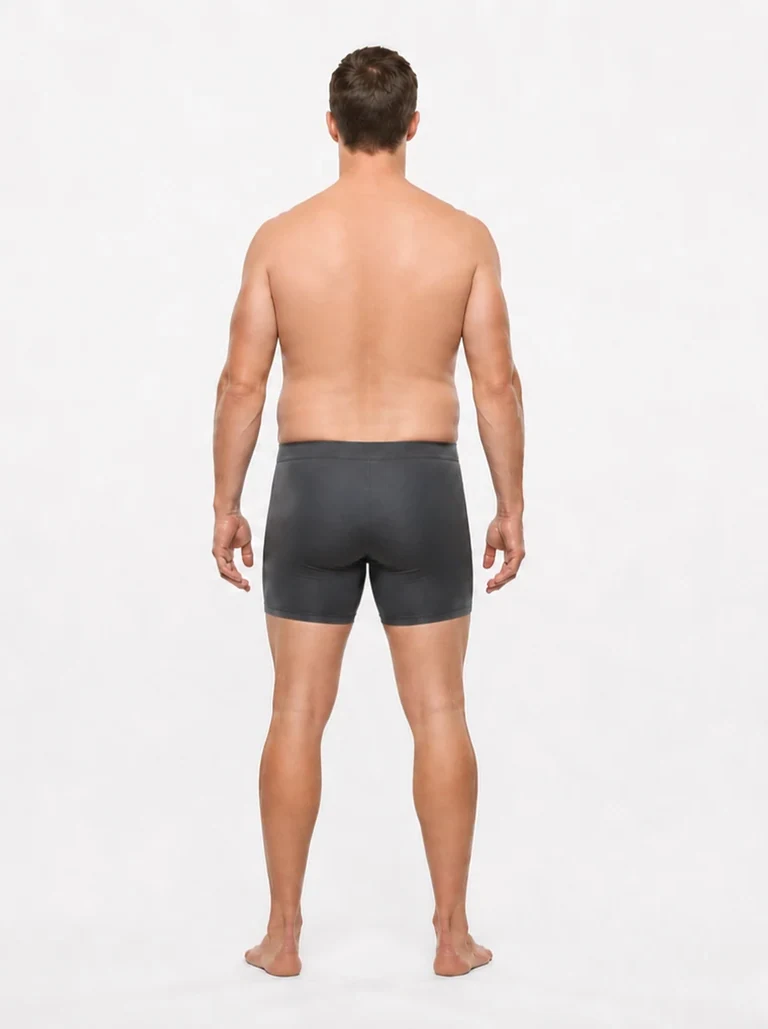
25% — the midsection rounds and love handles become visible, while definition through the chest, waist, and lower back softens substantially.
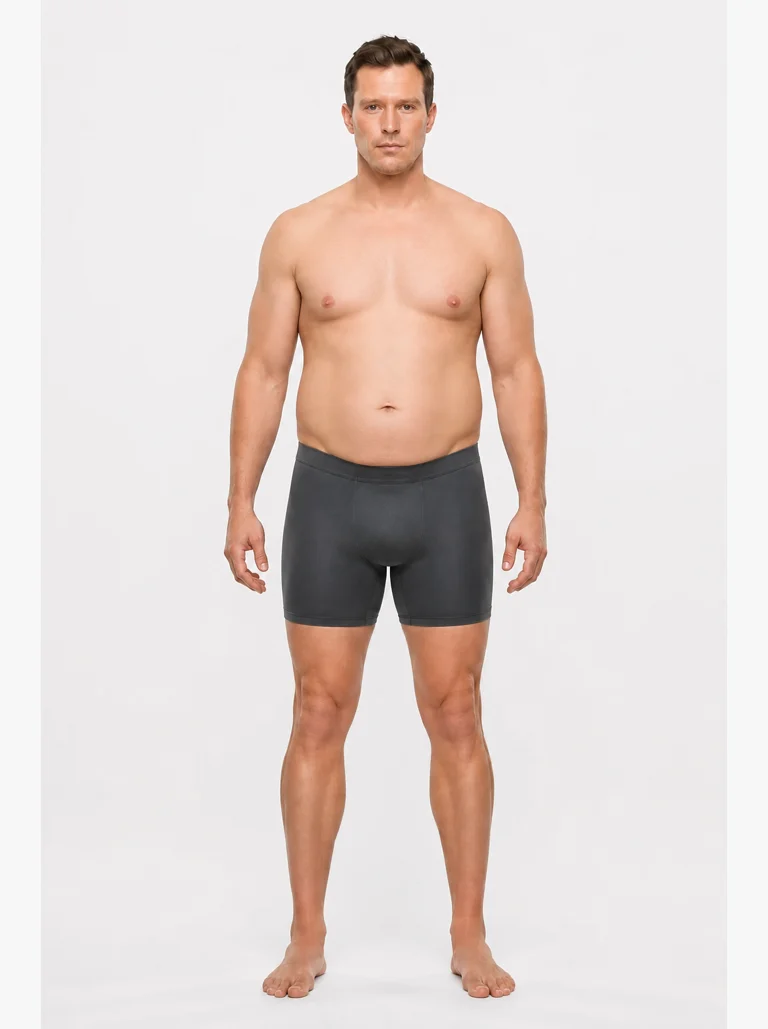
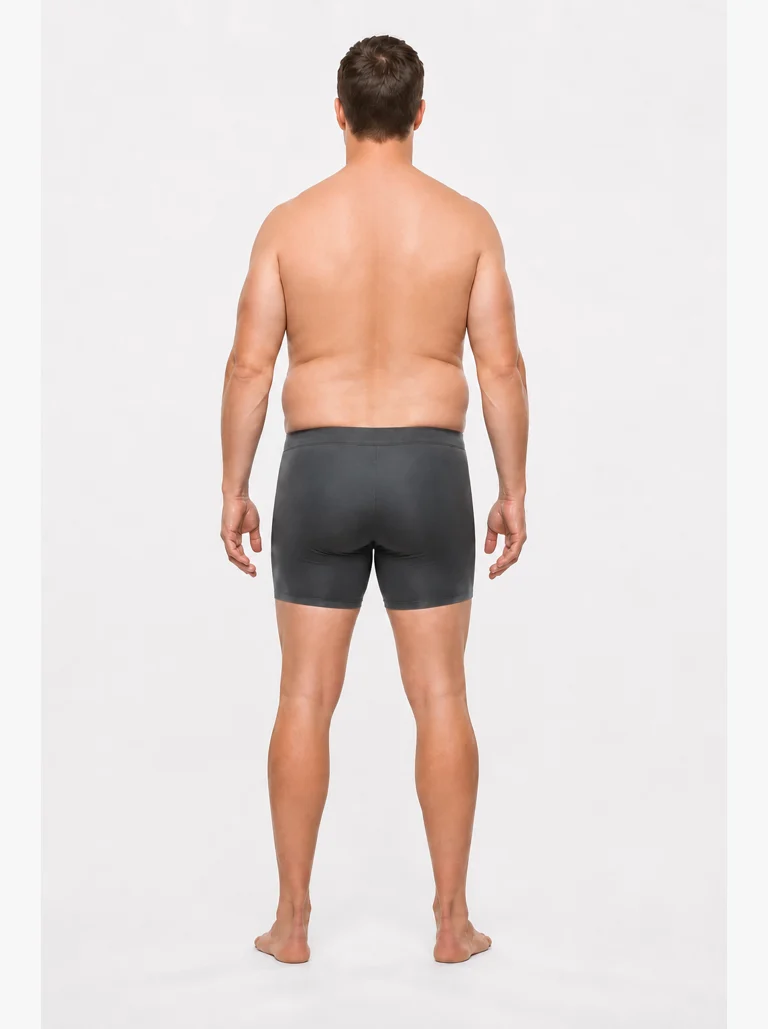
27% — more pronounced abdominal and lower-back softness, sitting clearly between the 25% and 30% references.
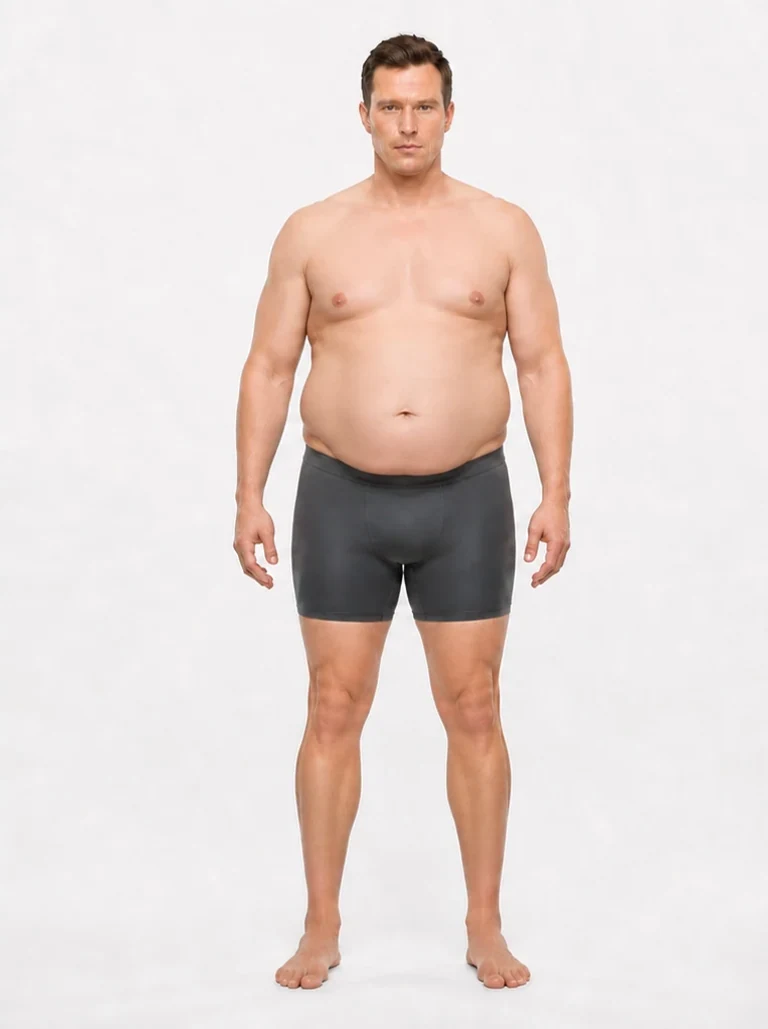
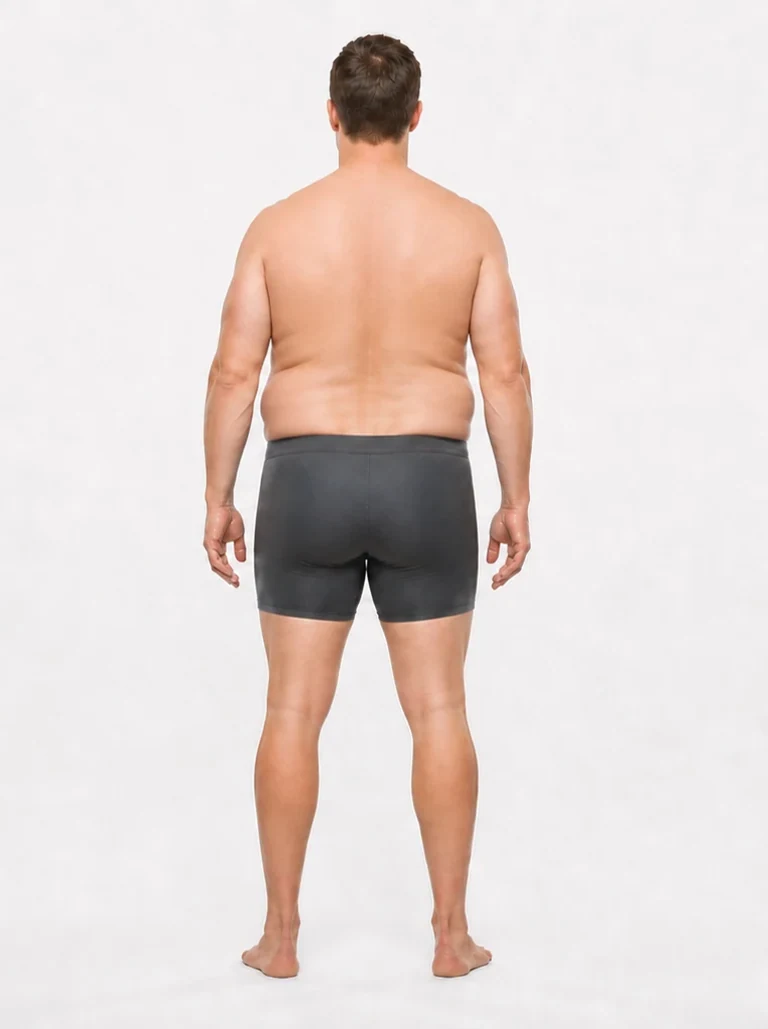
30% — pronounced abdominal and lower-back storage dominates the silhouette, with little visible muscle separation.
For a fuller breakdown at a single level, the body fat picture gallery has a dedicated reference page per level — 15% body fat on a man and 25% sit either side of the renders above.
What does each level look like on a woman?
Women's essential fat runs higher than men's, so the scale shifts — the leanest healthy range for a woman sits where a man's mid-range does, and that's physiology rather than fitness.
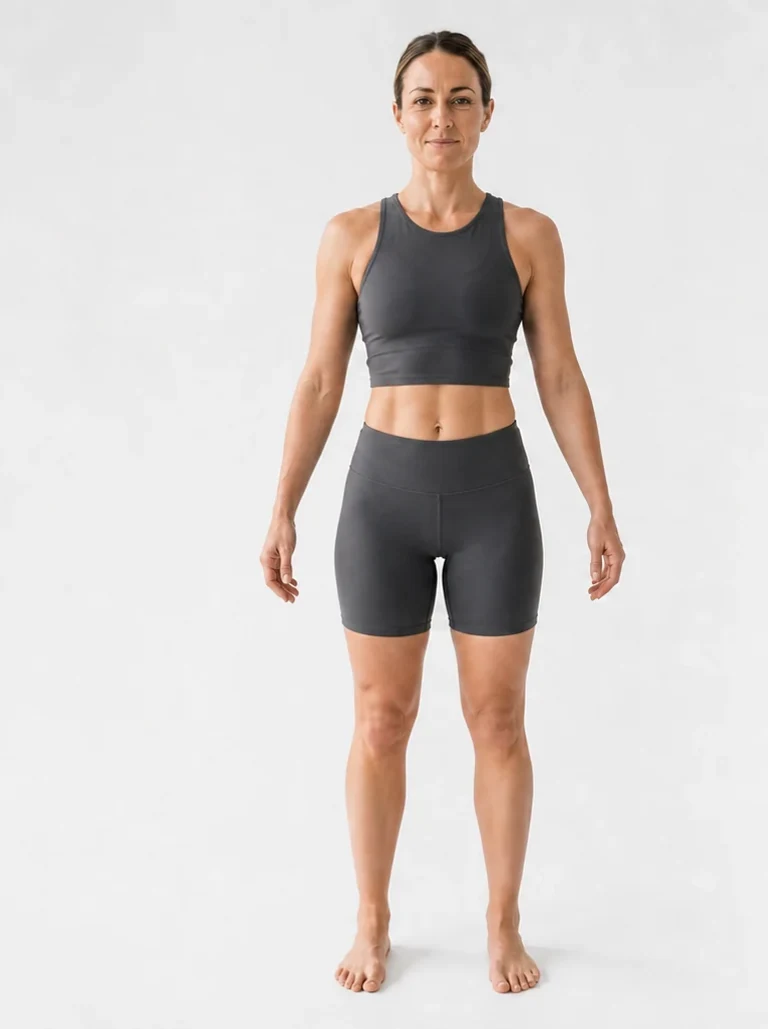
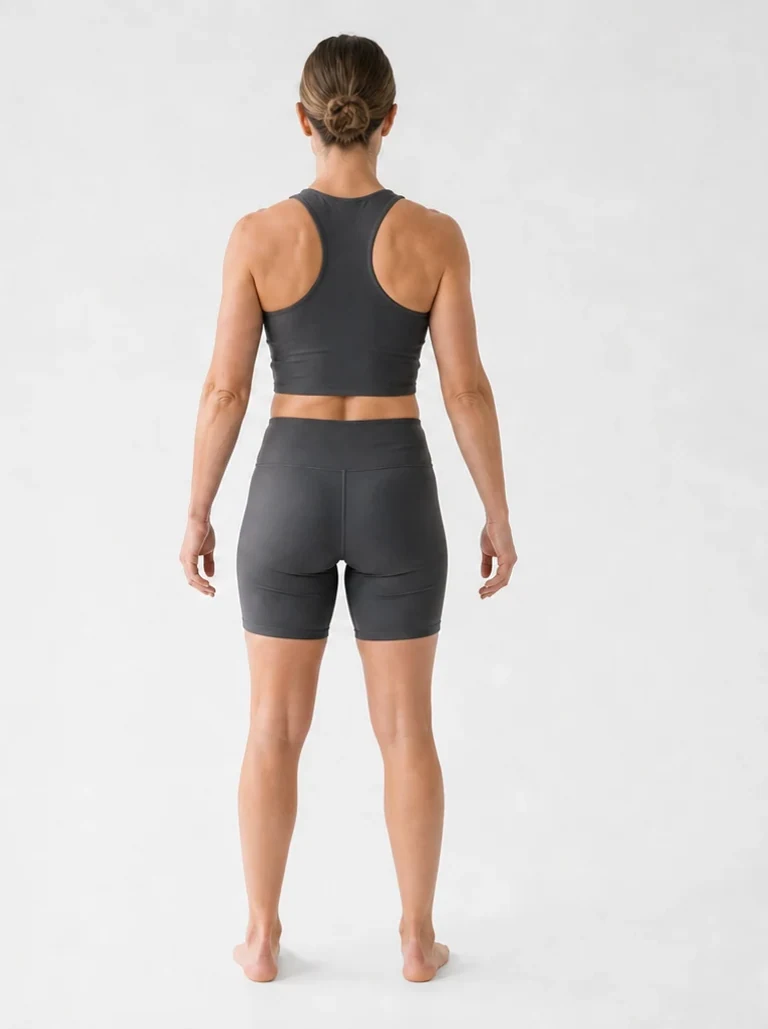
18% — very lean for a woman, with visible abdominal definition and muscle separation. Commonly an athlete's range, near the floor of what is sustainable.
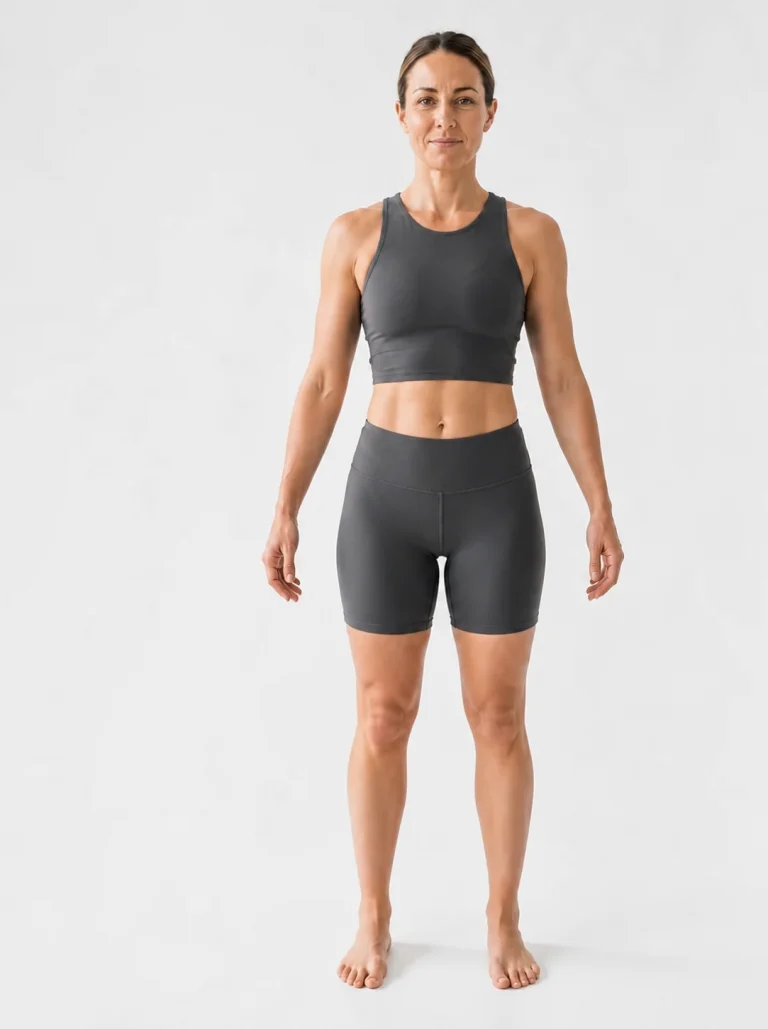
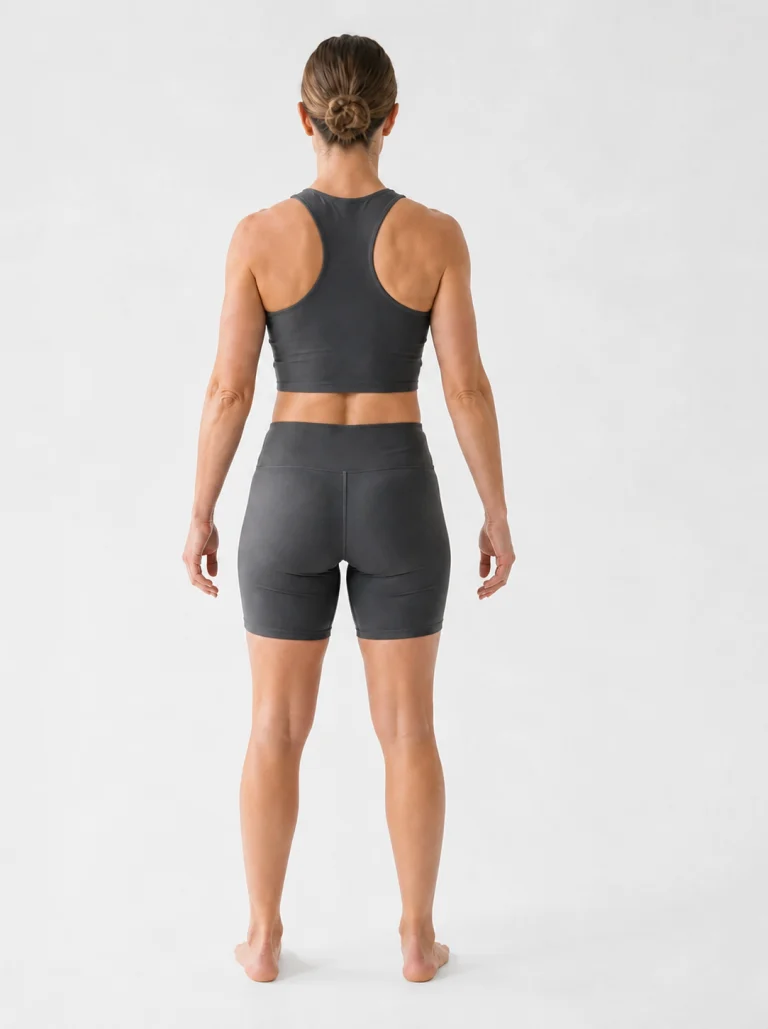
19% — lean and athletic, with visible tone and a small increase in natural softness from the 18% reference.
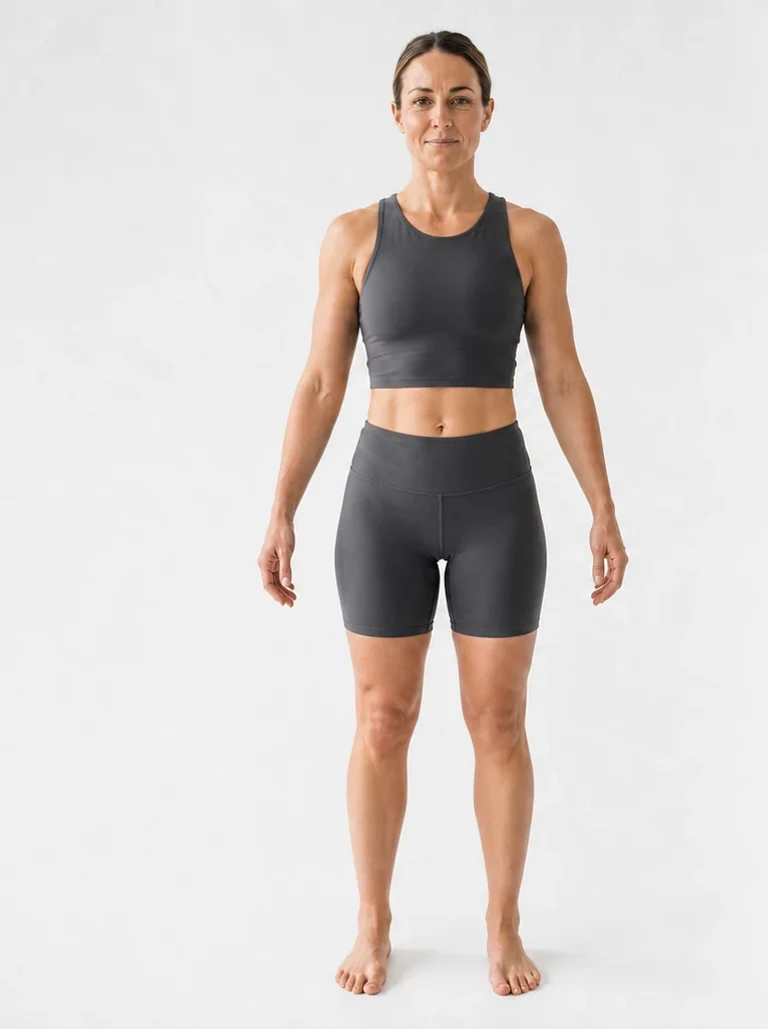
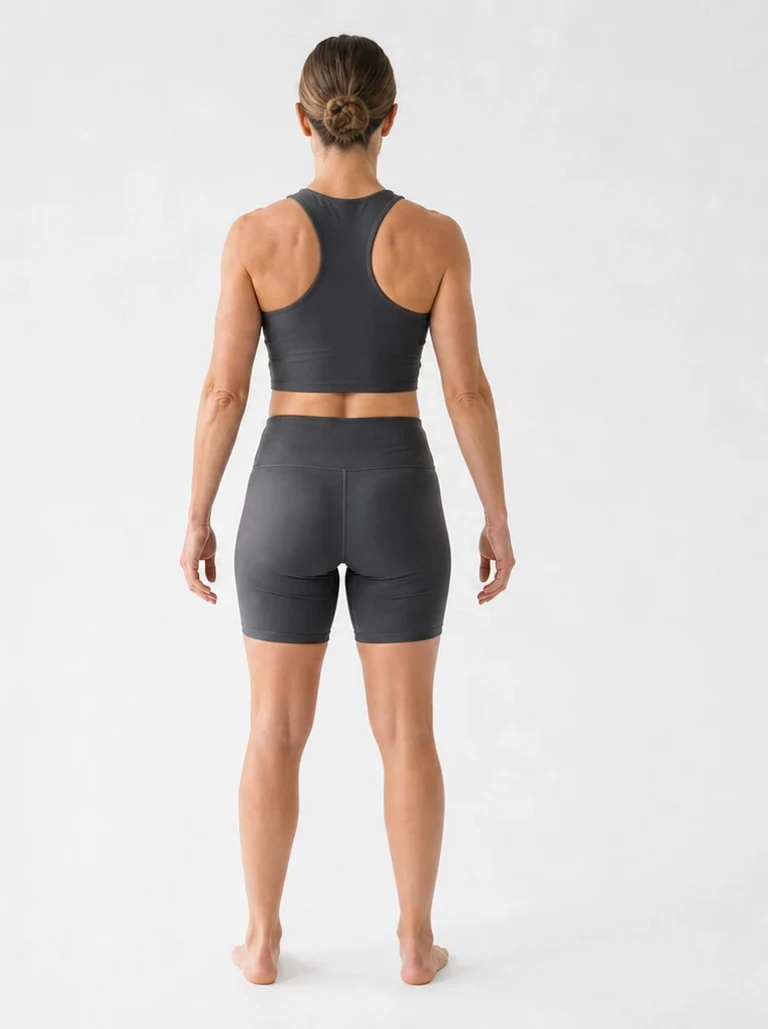
20% — lean and athletic, with a flat waist, light definition, and clear tone through the shoulders, back, and legs.
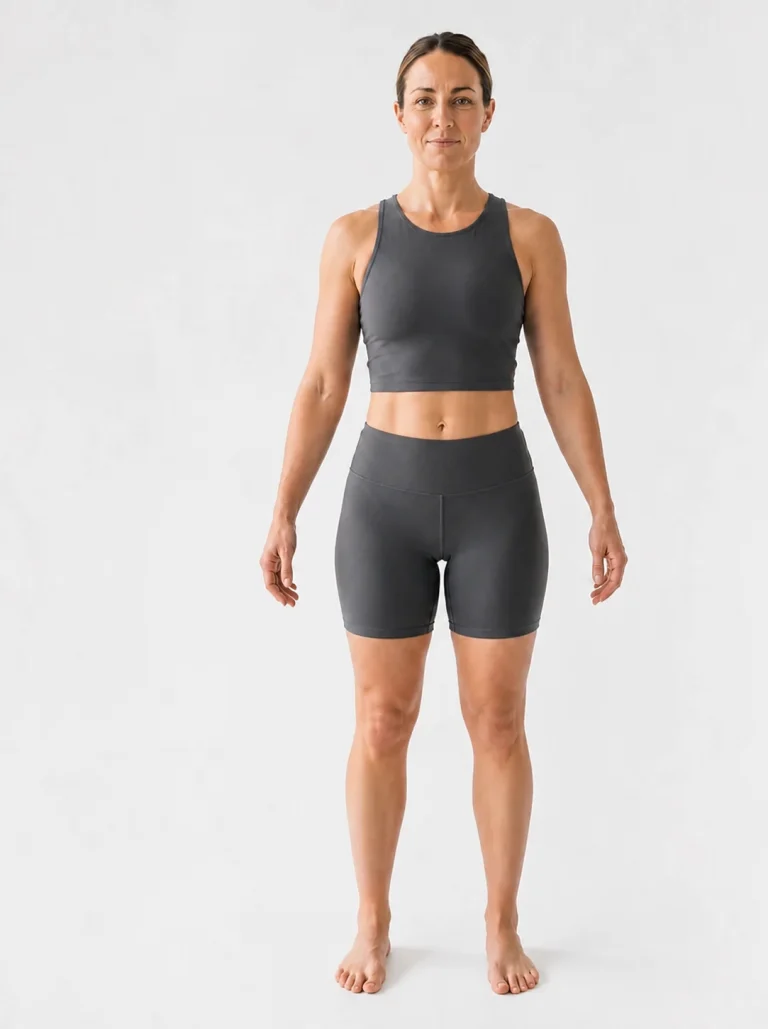
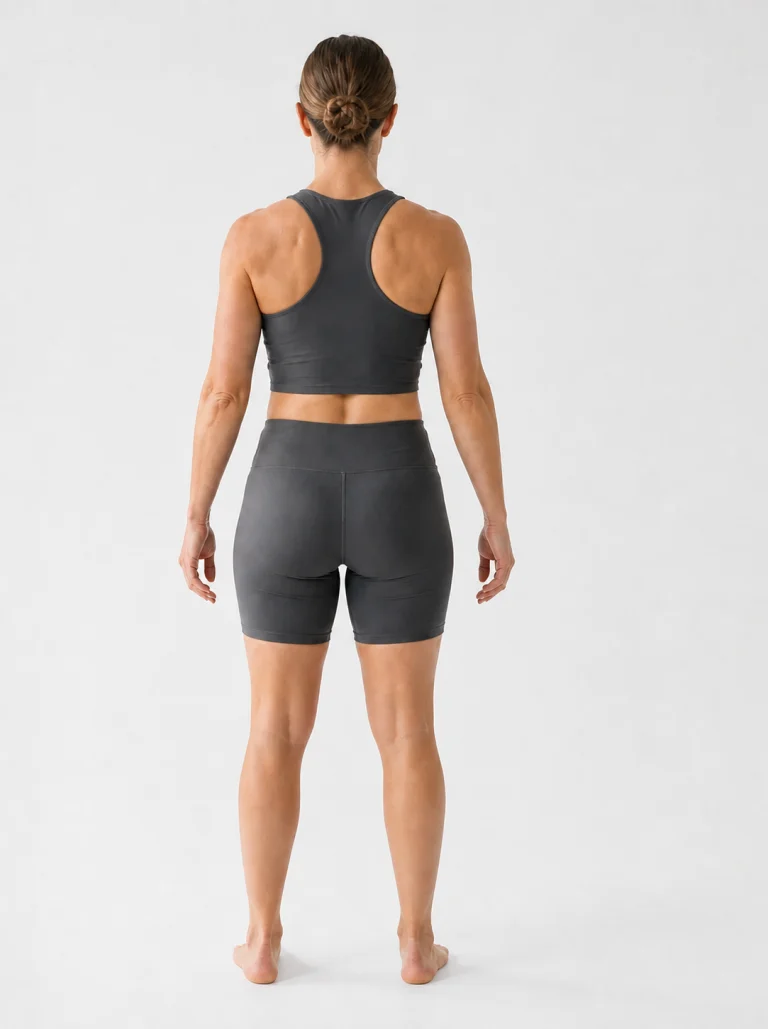
21% — a flat athletic waist with clear tone and gradually softened muscle edges.
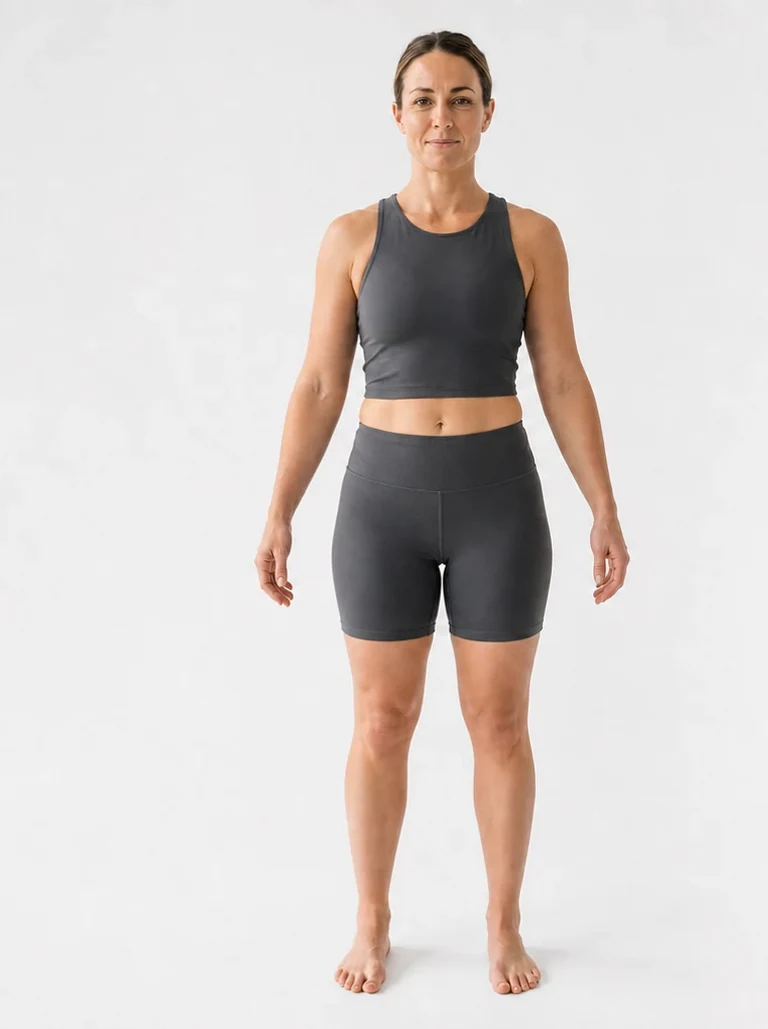
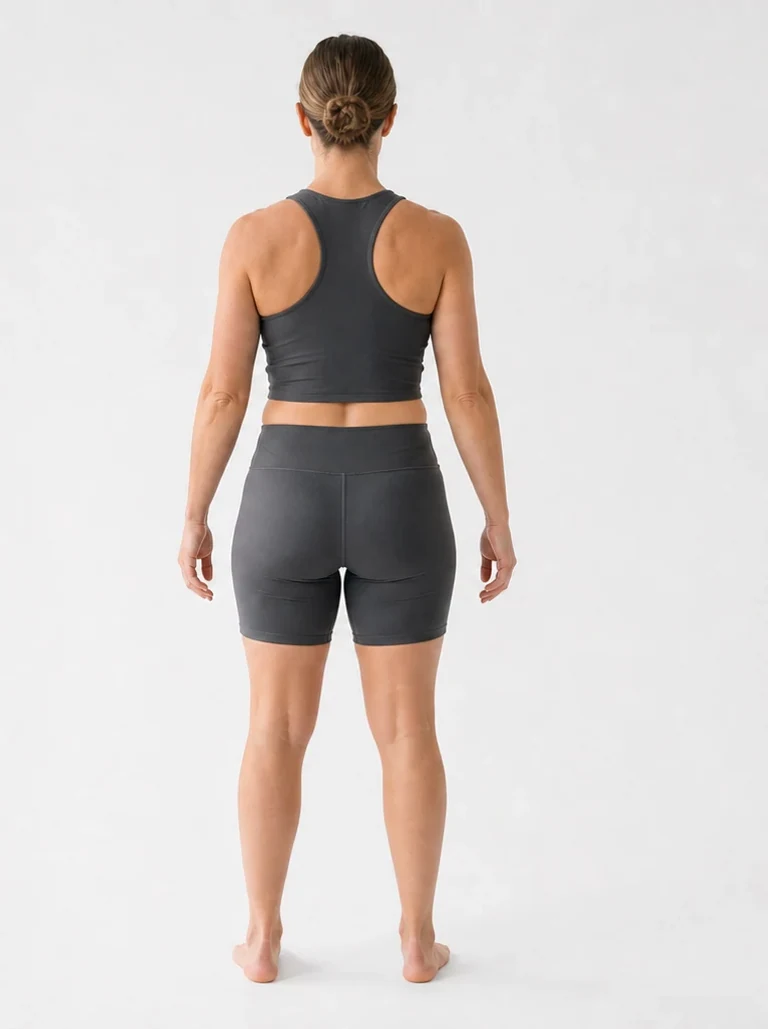
22% — athletic and toned. Shoulder and leg shape remains clear, with a flat midsection and naturally softened muscle edges.
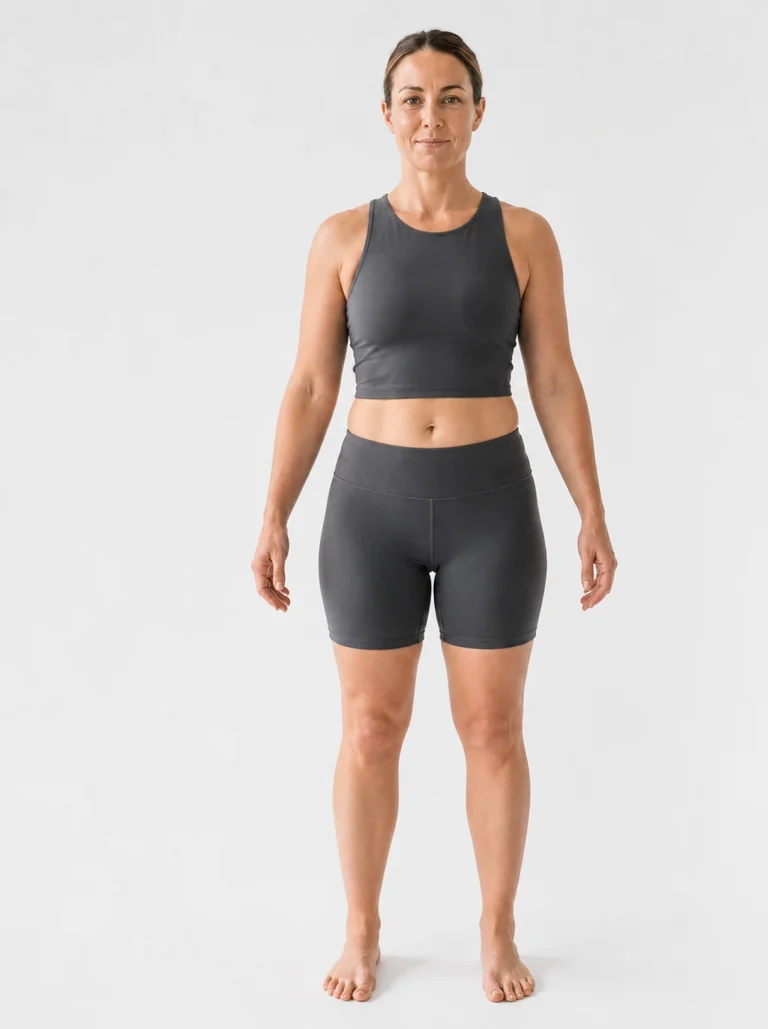
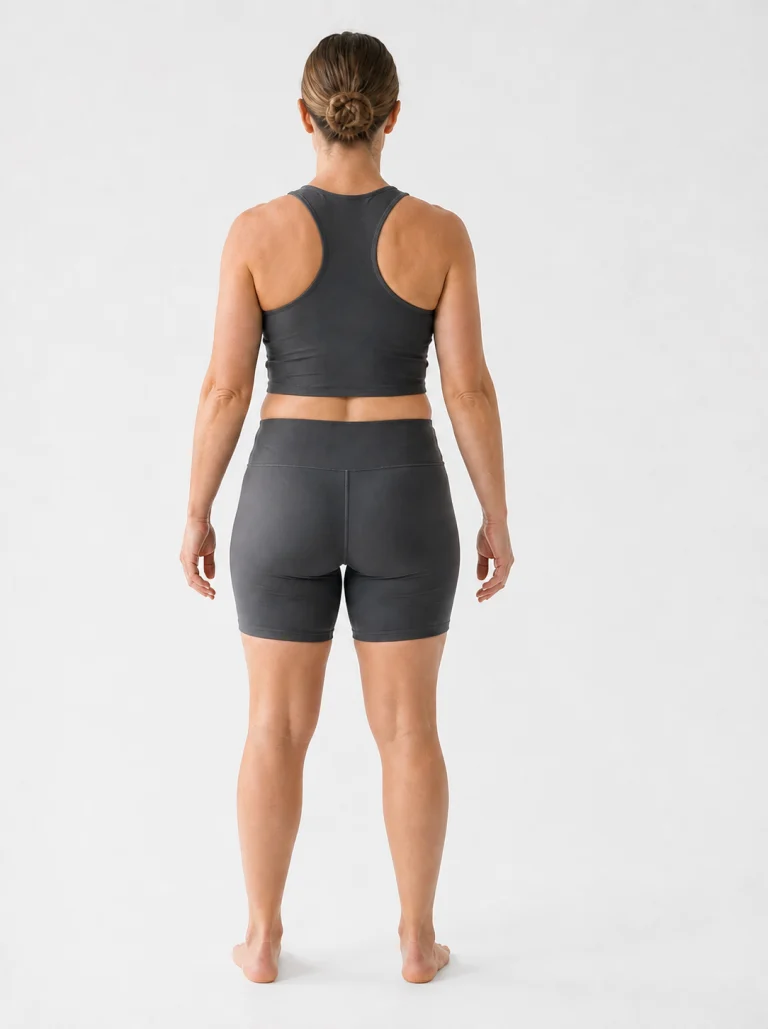
23% — toned with more natural curves, while the waist and limbs retain an athletic shape.
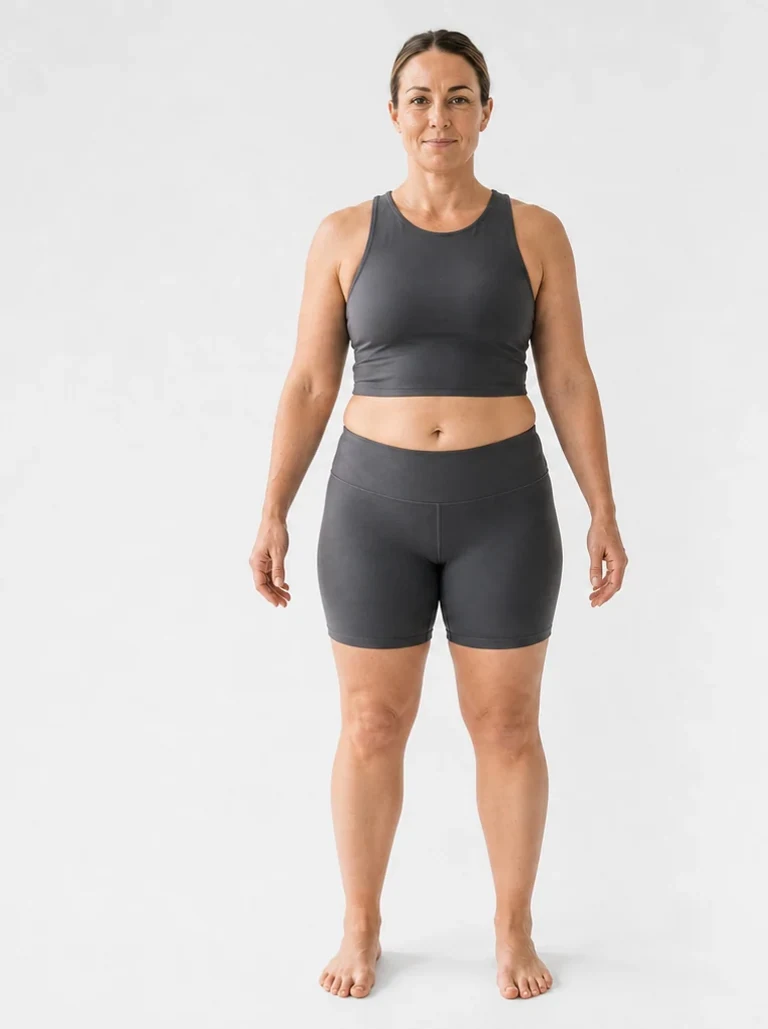
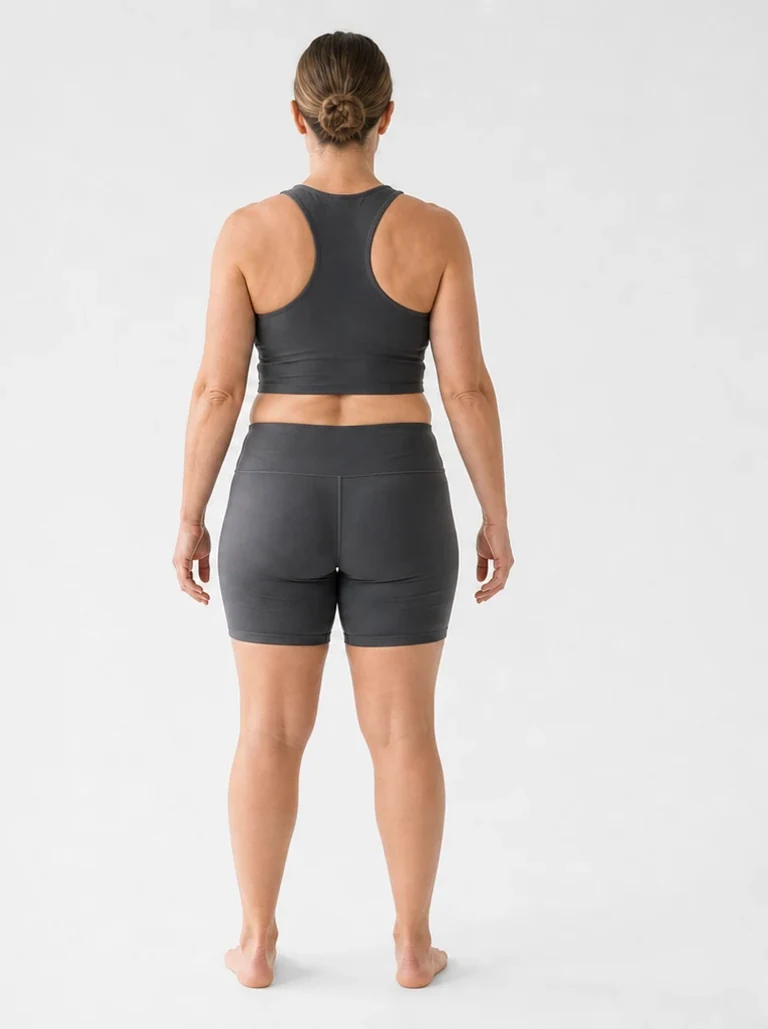
25% — fit with natural curves. The waist remains controlled while the hips and thighs look fuller and definition becomes subtler.
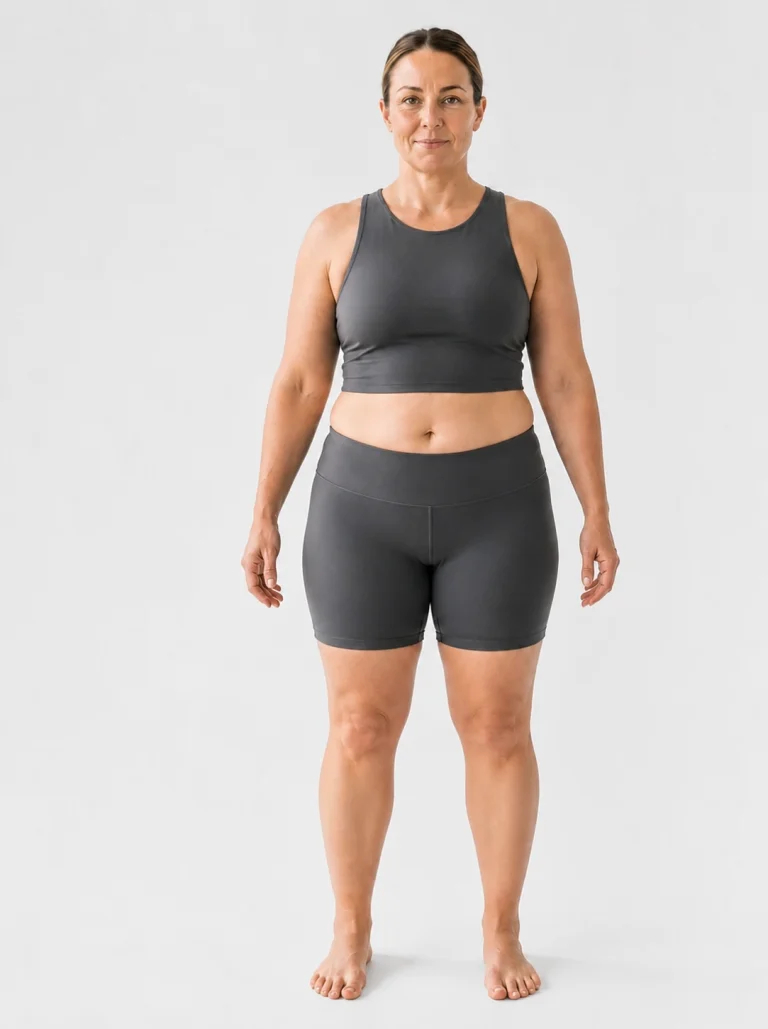
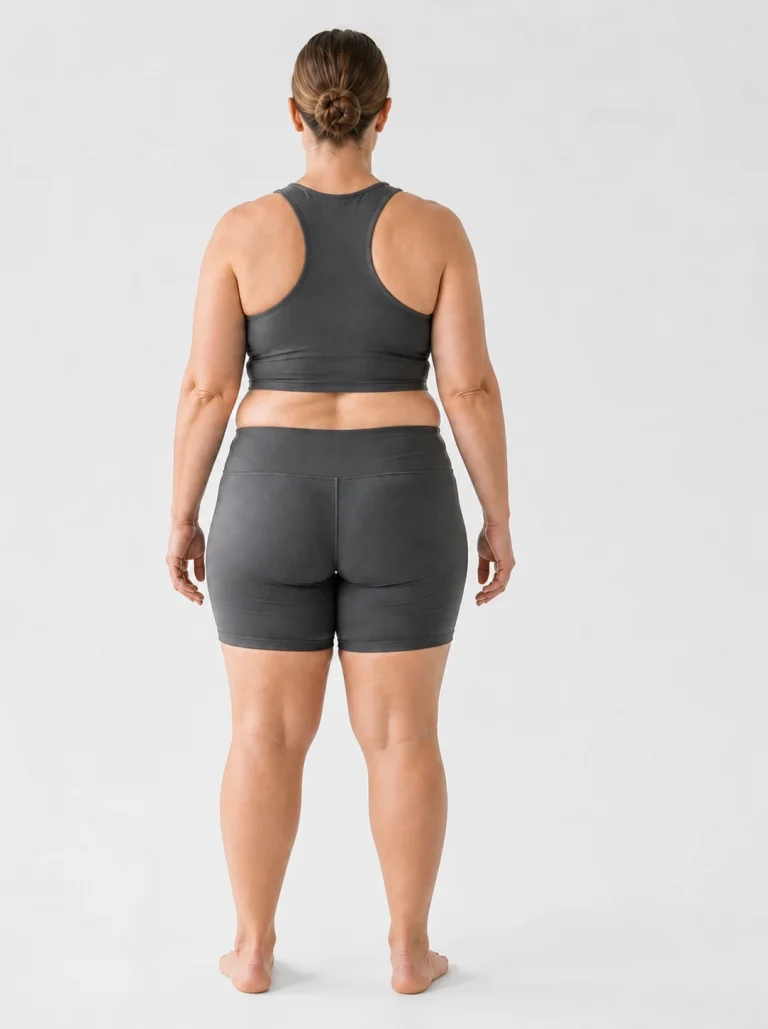
27% — a healthy, average-looking range with a softer waist and fuller hips and thighs.
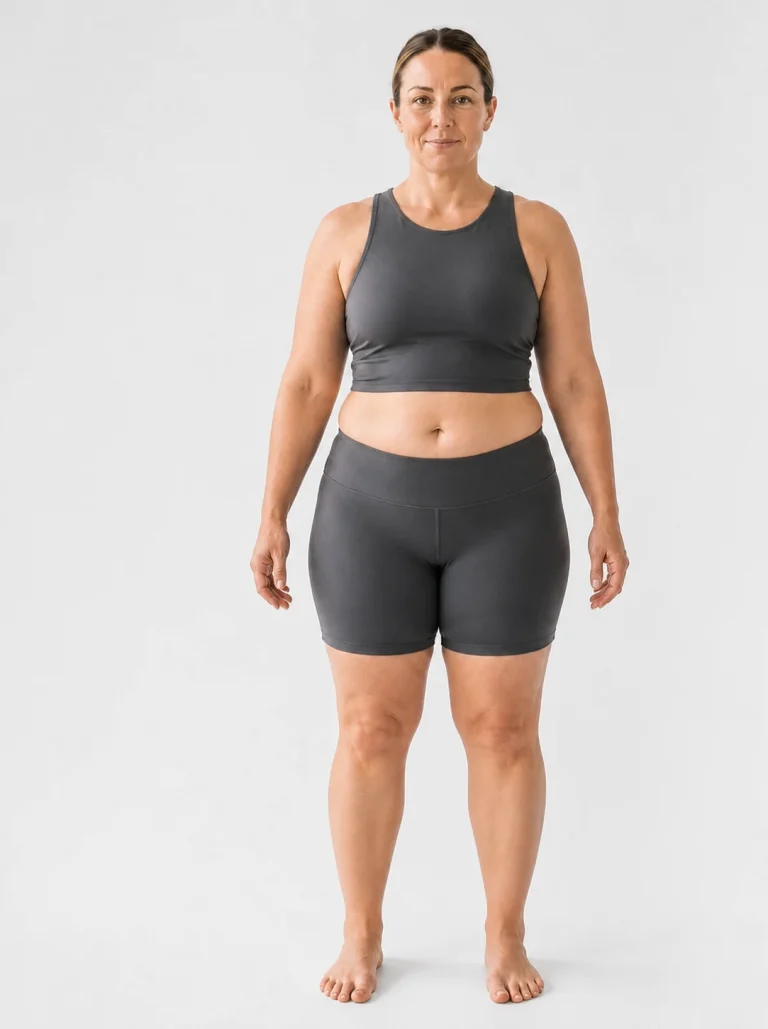
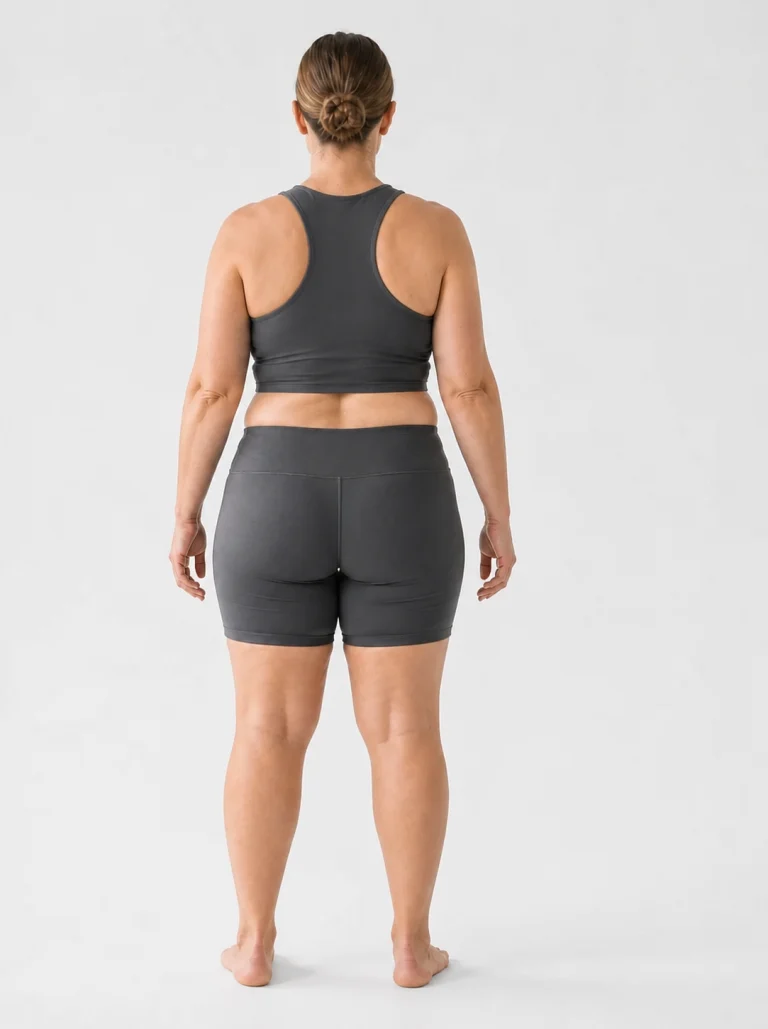
28% — soft natural curves with a gently rounded midsection, bridging the upper twenties toward 30%.
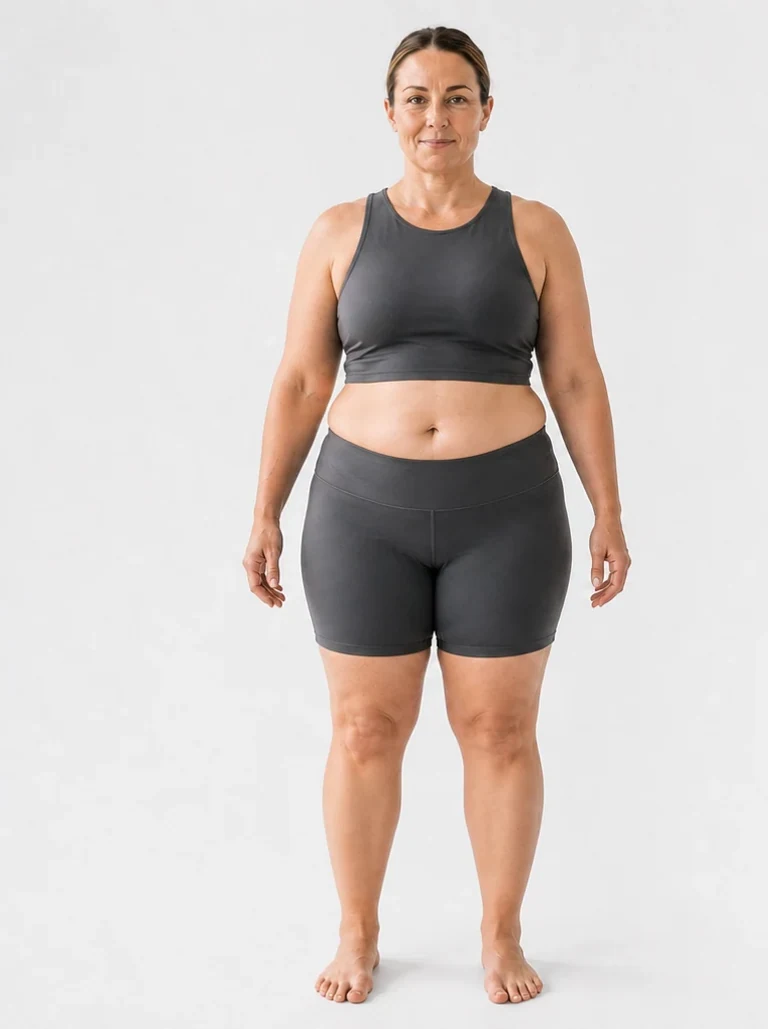
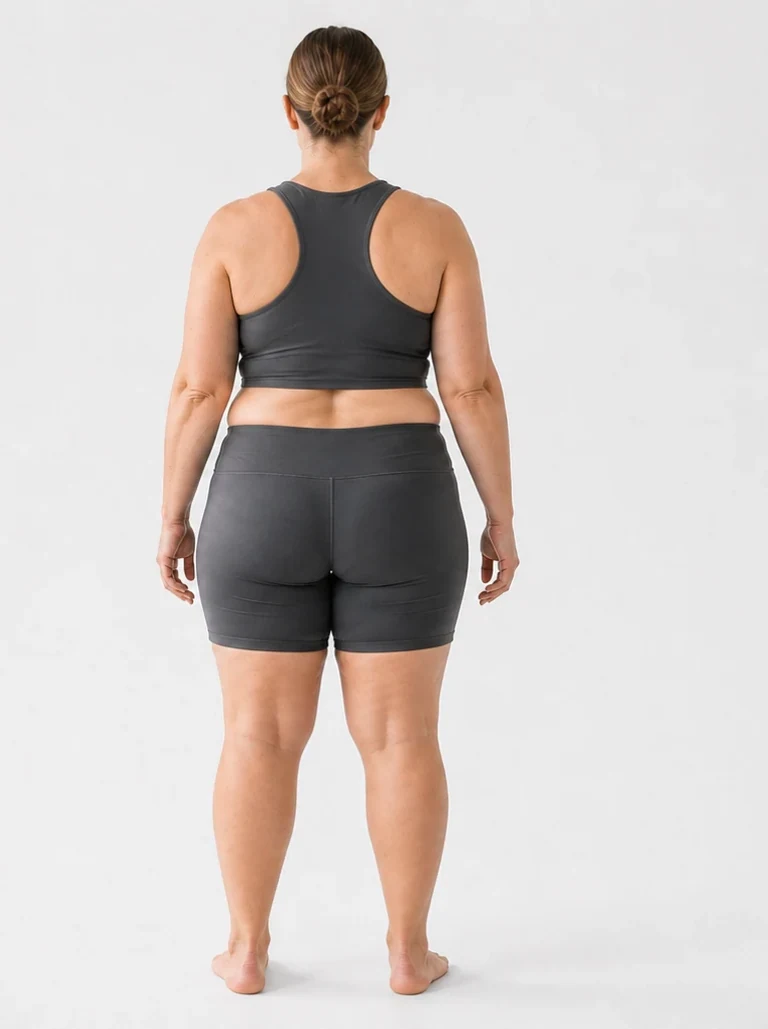
30% — a softly rounded midsection with fuller hips and thighs and minimal resting definition.
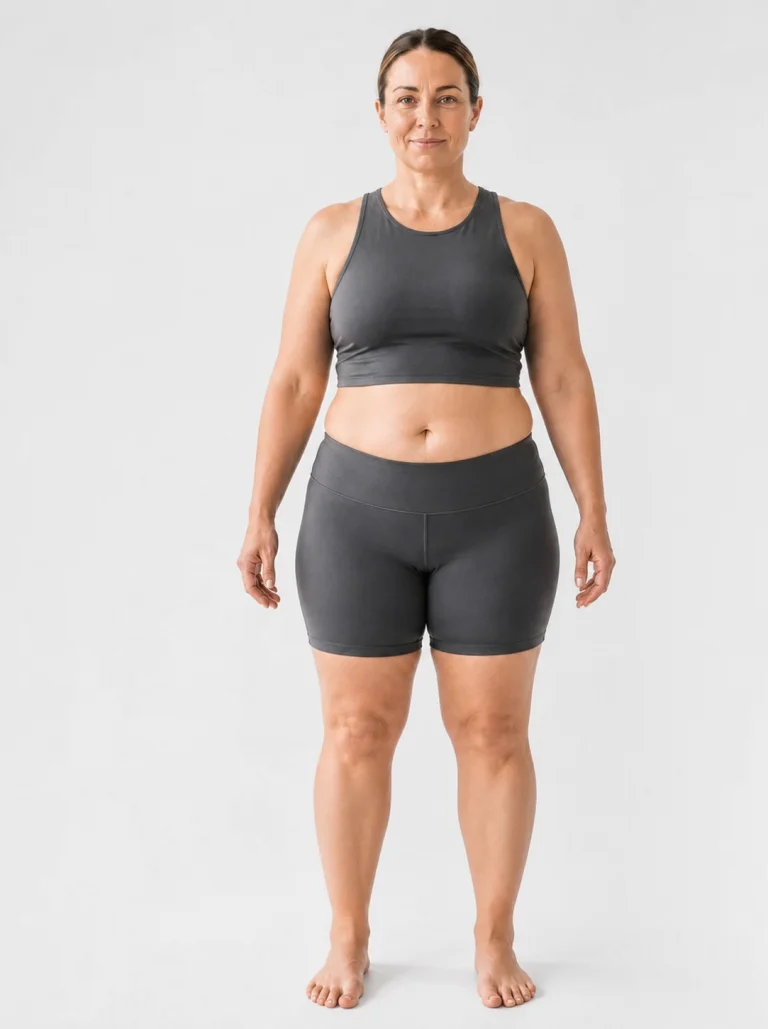
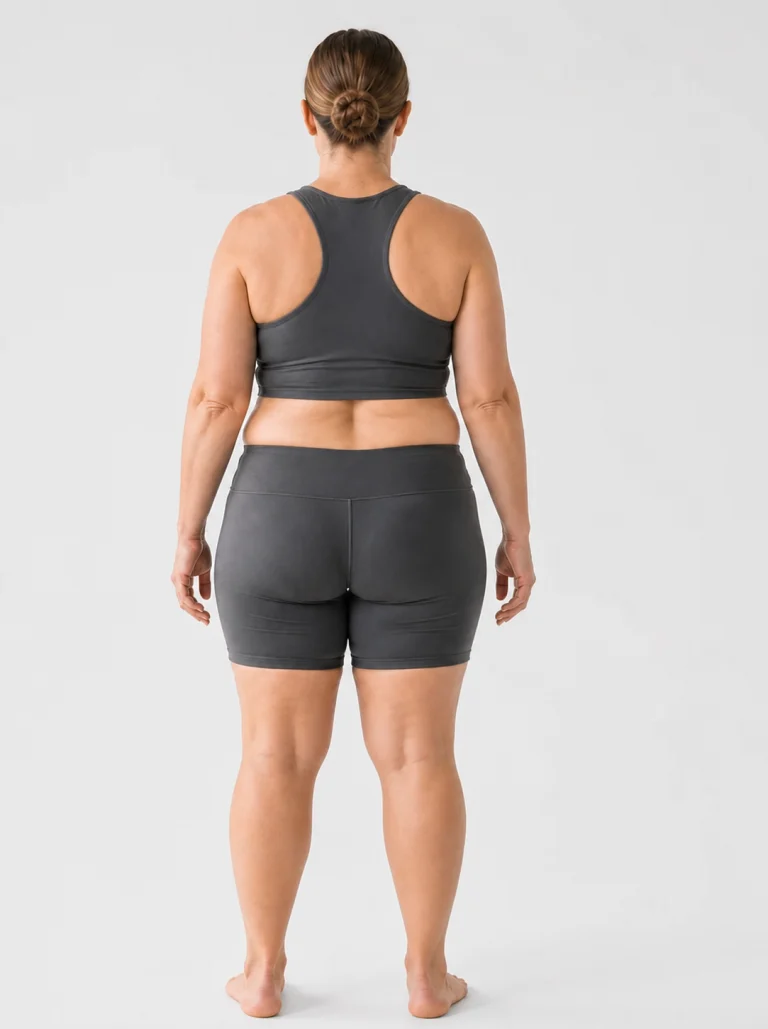
32% — the waist and lower body broaden further, with visible softness through the abdomen, back, hips, and thighs.
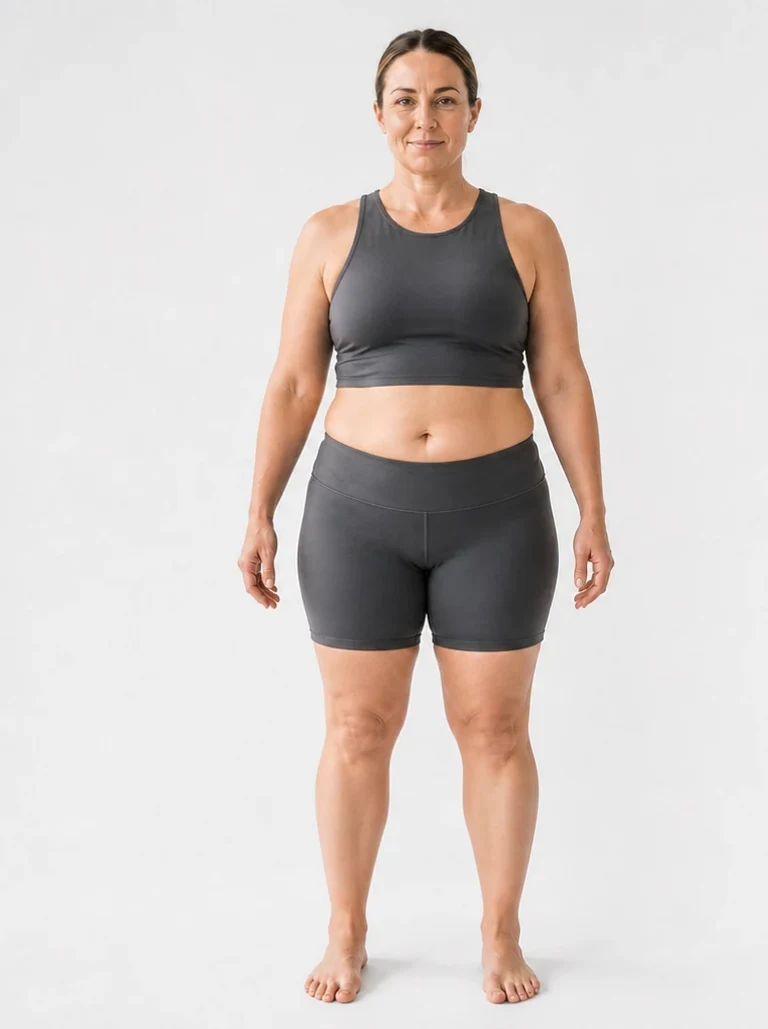
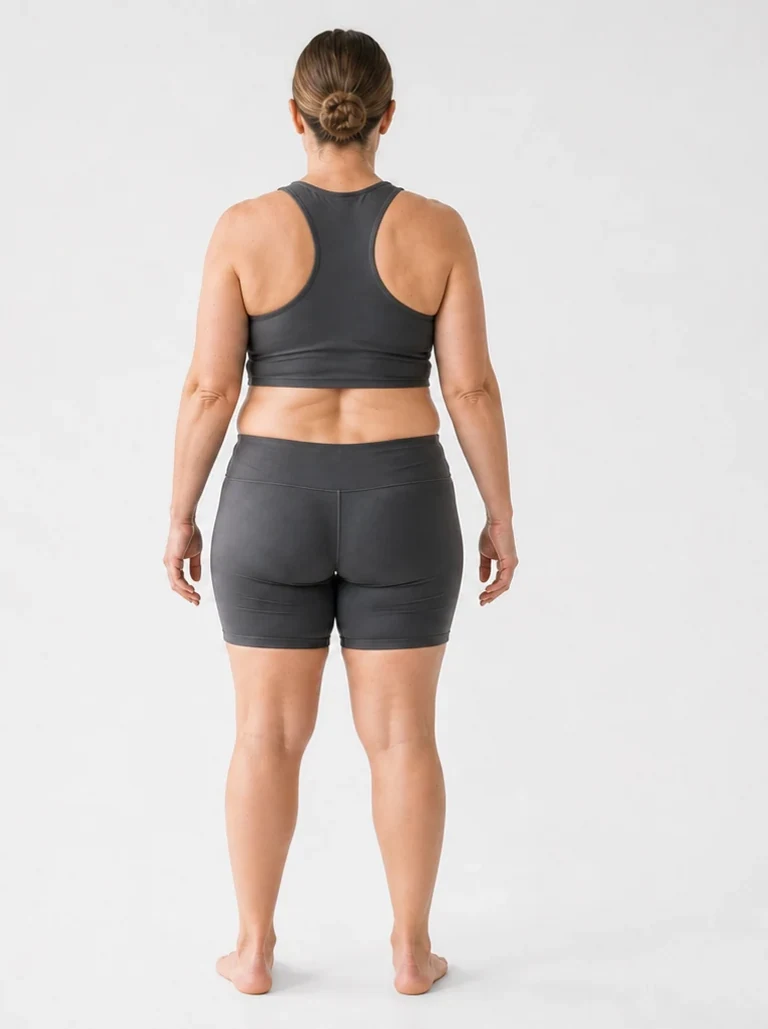
35% — the waist broadens and fat storage becomes more pronounced through the midsection, lower back, hips, and thighs.
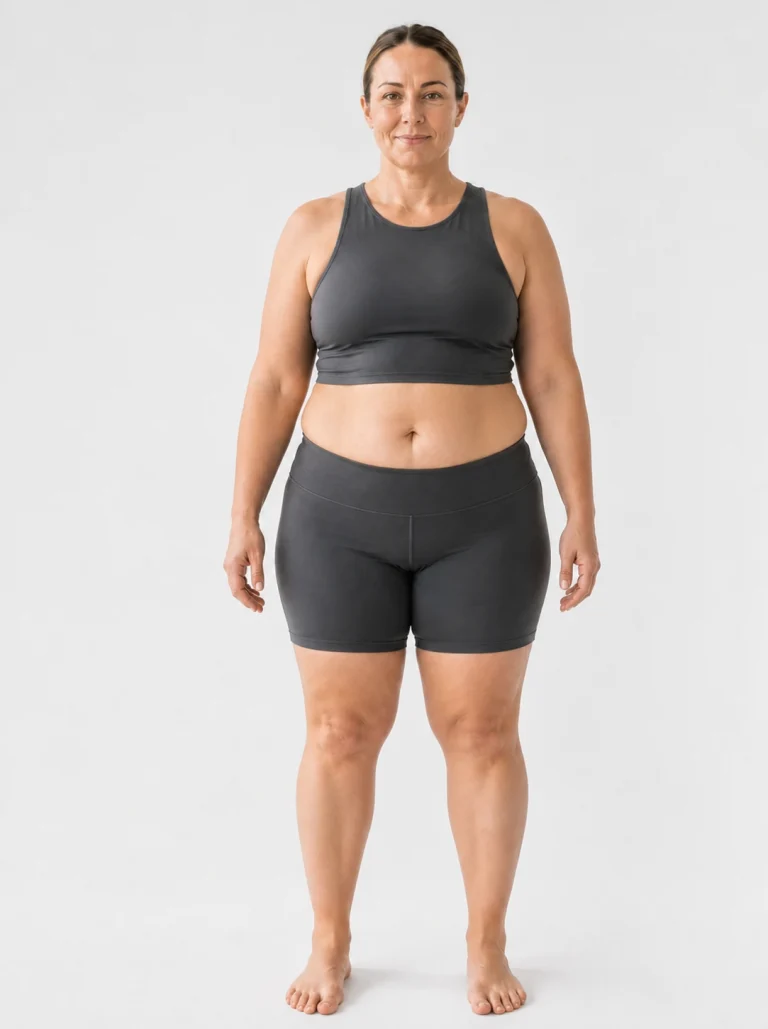
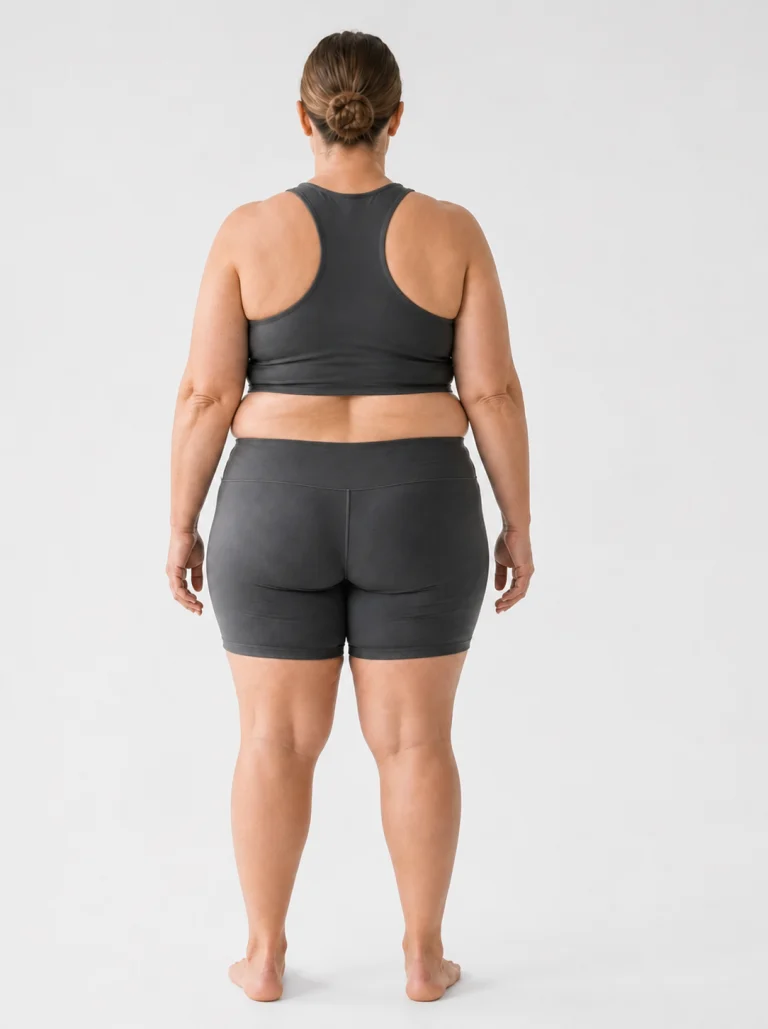
37% — more pronounced storage through the trunk and lower body, midway between the 35% and 40% references.
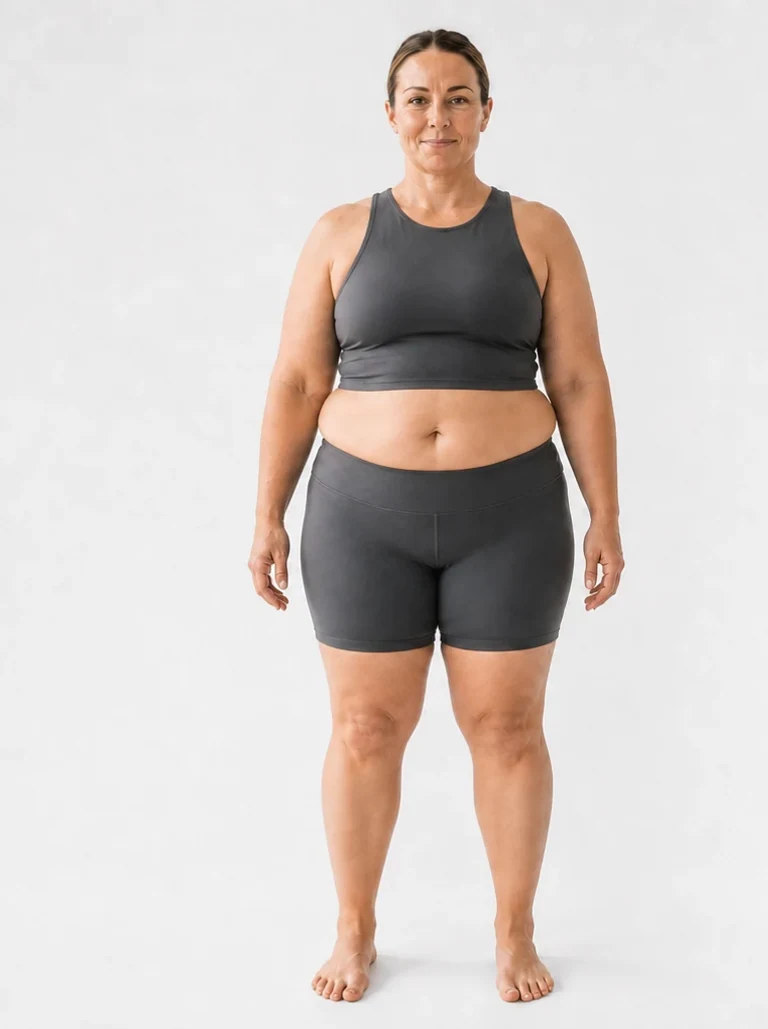
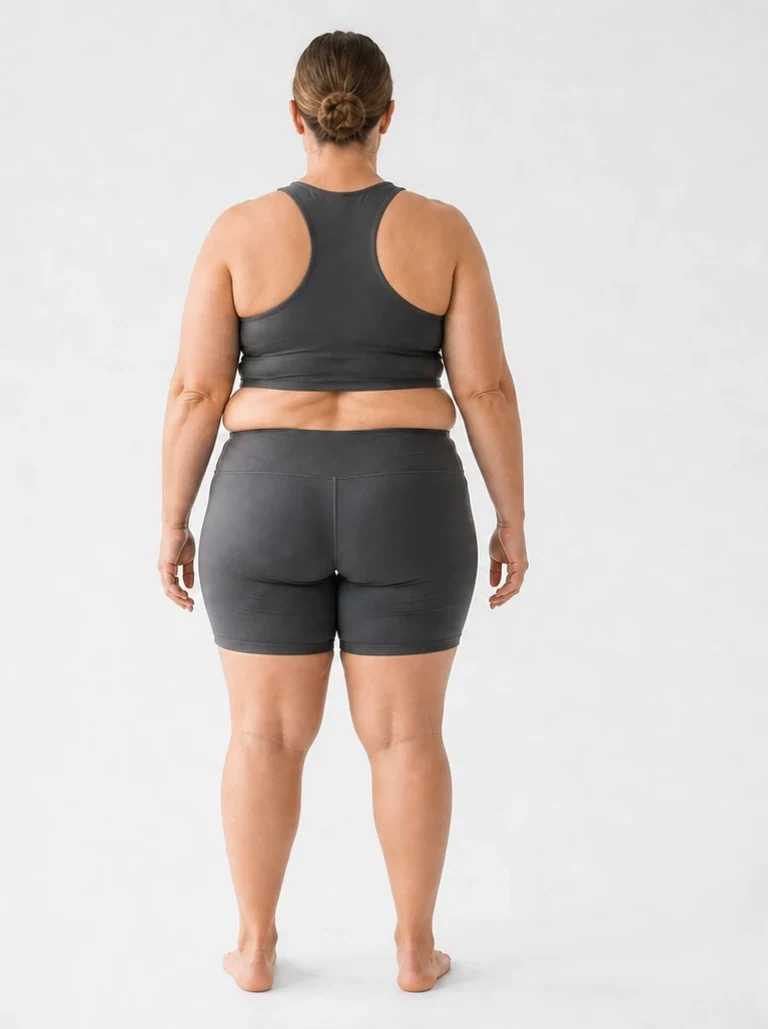
40% — significant fat accumulation extends through the trunk and limbs, clearly visible from both views.
The gallery covers the women's scale too — 25% body fat on a woman and 35% are the reference pages closest to these renders.
Why do two people at the same number look different?
Because the percentage describes a ratio, and the body decides the layout. Muscle is the biggest factor: a muscular person at 20% shows shape everywhere, while an untrained person at the same 20% simply looks soft — the skinny-fat pattern in a single comparison.
Distribution is the second factor, and it's genetic. Some people store centrally, some in the hips and thighs; men and women differ systematically, and age shifts the pattern too. Height and frame width do the rest — the same pounds of fat spread differently across a 5'6" and a 6'2" skeleton.
So use the pictures as a band, and expect your version of any level to be personal. The renders control for everything except the one thing no reference image can: being you.
How do you find out your actual number?
Three routes, in descending accuracy and cost. A DEXA scan measures composition directly for roughly $100–150 a session. Smart scales estimate it at home with wide, hydration-sensitive error bars. And AI photo tools estimate it free — our body fat estimator reads a standardized photo in the browser, no signup.
For tracking change, consistency beats precision: a method with a stable error, repeated monthly, shows the trend clearly. That's the idea behind GainFrame — each photo gets a body fat estimate and a physique score, so this page's "which picture am I?" question becomes a dated trend line instead of a monthly squint at the mirror. iOS, estimates rather than clinical measurement, first 25 photos free.
Frequently asked questions
Are body composition pictures accurate for judging yourself?
They give you a band, and that's their honest limit. Visual comparison against standardized images typically narrows you to within several percentage points, which is enough to pick a training direction. Lighting, pump, water, and camera angle all move how you photograph, so compare a relaxed, consistent photo of yourself rather than a flexed gym-lighting shot.
Why do two people at the same body fat percentage look different?
Muscle mass, fat distribution, height, and frame width all change how a percentage presents. A muscular person at 20% shows shape everywhere; an untrained person at 20% just looks soft. Distribution is genetic too — some store centrally, others in the hips and thighs. The percentage describes the ratio, and the body decides the layout.
What is a healthy body composition?
Reference ranges commonly describe roughly 10–20% body fat as fit-to-healthy for men and 18–28% for women, with athletic ranges below that and elevated risk above roughly 25% for men and 32% for women. Muscle mass matters alongside fat — two healthy compositions can hold very different amounts of both.
How do I find out my own body composition?
Ranked roughly by accuracy: a DEXA scan measures it directly for around $100–150; smart scales estimate it at home with wide error bars; and AI photo tools estimate it free from a standardized picture. For tracking change over months, a consistent method matters more than the most accurate one — the trend survives a constant error.
Are these AI renders or real photos?
They are photorealistic AI renders from our body fat visualizer, generated at a standardized build, pose, and lighting so that composition is the only variable that changes between images. Real photos can't offer that control — no two real people differ only in body fat. The trade-off is stated openly: these show the pattern, and your body will express it with its own distribution.
Stop guessing which picture you are
GainFrame estimates your body fat from a photo and scores your physique 1–100 — so the comparison happens against your own last month, with numbers attached. Free to start on iOS.
Download GainFrame Free