
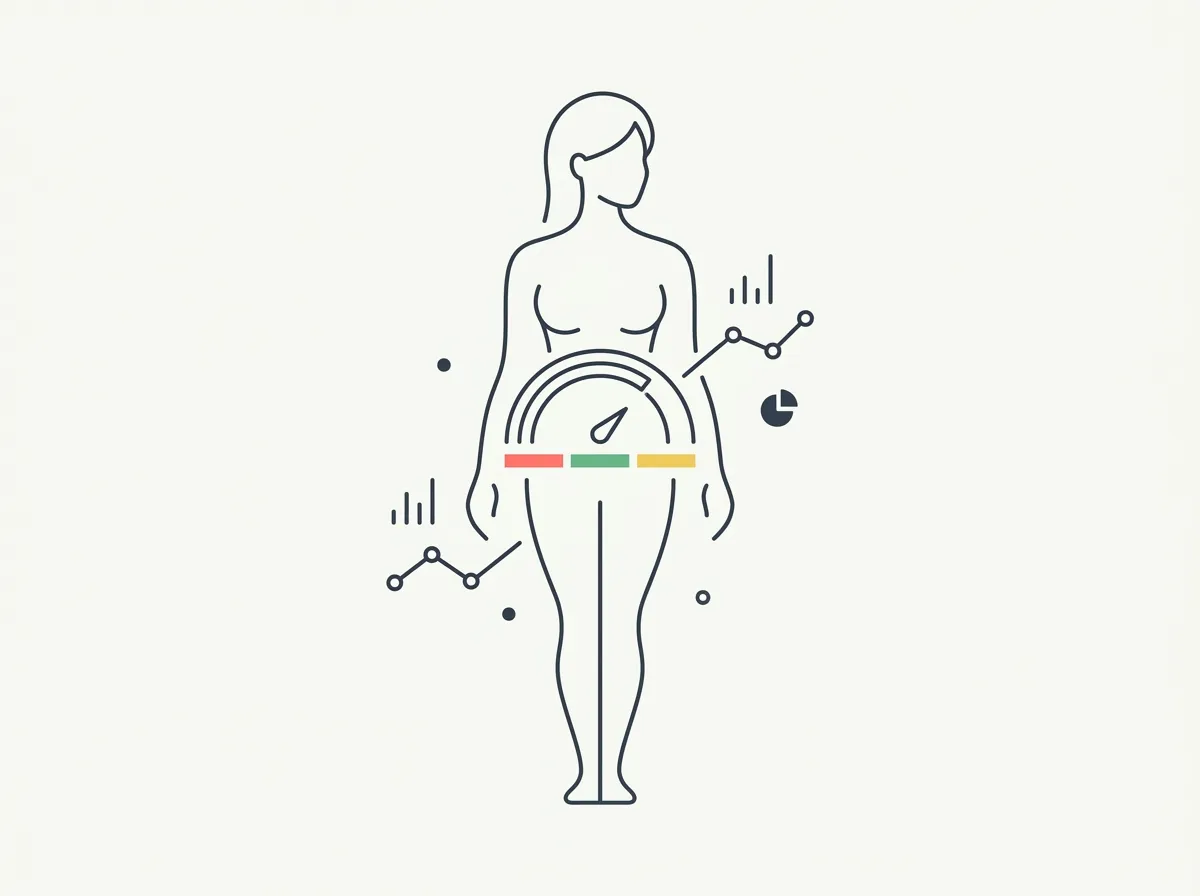
Quick answer: Commonly cited survey data puts the average American woman somewhere around 32 to 38 percent body fat depending on age. Category charts run lower: athletic 14–20%, fitness 21–24%, average 25–31%, obese 32%+. The typical woman therefore measures above the chart's average band — population averages describe what is common, and healthy ranges describe what physiology rewards.
Your smart scale says 31%, and you have no idea how to read it. A fitness influencer's chart implies that's the edge of a problem. Your doctor didn't mention it. And every reference photo you find seems calibrated to men, where numbers like 15% get thrown around as if they applied to you.
They don't. Women's body fat runs on different math — higher by design, distributed differently, and shifting with age in ways male charts never mention. This page gives you the women-specific numbers: what the average woman actually measures, what the category ranges mean, and what specific percentages look like on a female body. For the decade-by-decade tables covering both sexes, our average body fat by age guide has them; for level-by-level reference photos, the body fat percentage chart walks every range. This page is the female-first version of both.
What is the average body fat percentage for women?
Commonly cited figures from national health survey data put the average American woman somewhere around 32 to 38 percent body fat, depending on the decade of life — roughly 32 to 35 percent for women in their 20s, drifting toward 38 to 41 percent by the 50s. The by-age guide breaks that out decade by decade, so this page won't repeat the table.
Here's the part that confuses almost everyone: the band that category charts label "average" for women is 25 to 31 percent, and the actual population average sits above it. Both numbers are legitimate. The chart band comes from older body-composition classification tables, and the survey average describes a population that has gotten heavier since those tables were drawn.
The practical translation: a woman at 28 percent is inside the chart's average band while measuring leaner than the majority of American women. A woman at 34 percent is close to the true population average while sitting past the threshold where charts commonly flag elevated risk. "Average" is doing two jobs in this topic, and knowing which one a chart means saves you a lot of misplaced worry.
What are the healthy body fat ranges for women?
The commonly cited women's categories, framed for female physiology rather than adapted from male numbers:
| Category | Women's body fat | What it means |
|---|---|---|
| Essential fat | 10–13% | The minimum for basic hormonal and reproductive function. Competition-day leanness; unsustainable and commonly disruptive to cycles. |
| Athletic | 14–20% | Visible muscle definition and some ab visibility. Typical of competitive athletes; takes deliberate work to hold. |
| Fitness | 21–24% | The "toned" look — flat stomach, defined arms and legs, curves retained. Compatible with normal life and normal hormones. |
| Average / acceptable | 25–31% | Soft midsection, fat mostly at hips and thighs, minimal visible definition. Common and within acceptable health guidance. |
| Elevated / obese | 32%+ | Risk markers climb, and fat increasingly accumulates around the stomach as levels rise. |
Two women-specific notes on reading this table. First, the floor is real: essential fat near 10 to 13 percent supports hormonal function, and pushing under the athletic range commonly costs women their menstrual cycle, bone density, and energy long before it costs them anything aesthetic. Chasing men's numbers on a female body is a physiology error, and no coach worth listening to prescribes it.
Second, the boundaries are softer than they look. Measurement methods disagree by several points on the same woman, and where you personally look and feel best within a range is individual. If your reading lands within a couple of points of a boundary, you effectively straddle it.
Why do women's body fat percentages run higher than men's?
Because the baseline is different, for reasons that are commonly attributed to reproductive and hormonal biology. Essential fat — the amount below which basic function suffers — is commonly cited at roughly 10 to 13 percent for women versus 2 to 5 percent for men. Every category boundary shifts up by a similar amount, so women's "athletic" starts where men's "average" does, and that's parity rather than a gap.
Hormones drive the distribution too. Estrogen preferentially directs fat to the hips, thighs, and buttocks — subcutaneous storage that is, as commonly reported in the research, more metabolically benign than the visceral fat men accumulate at the belly. A woman and a man at the same percentage carry it in visibly different places, and hers is generally the healthier pattern.
The comparison that actually works: subtract roughly 8 to 10 points to translate between sexes. A woman at 22 percent and a man at 13 percent are at comparable leanness relative to their physiology. Judging your 27 percent against a boyfriend's 18 percent compares apples to a different species of apple.
Where do women store fat, and why does it shift with age?
Through the 20s and 30s, the estrogen-driven pattern dominates: hips, thighs, buttocks, with the midsection relatively spared. This is the pear shape, and it's the reason a woman can measure 30 percent while keeping a defined waist.
Perimenopause rewrites the map. As estrogen declines, storage shifts toward the abdomen — commonly reported as the same weight redistributing even when the scale barely moves. Muscle also becomes harder to hold, which nudges the body fat percentage up at a stable weight because the lean side of the ratio shrinks. Our menopause and body composition guide covers what changes, what's trackable, and what training does about it.
The tracking consequence matters at every age: scale weight misses both shifts entirely. A woman whose fat is migrating to her midsection at a constant weight, or who is losing muscle at a constant weight, sees a flat line on the scale while her composition moves. Waist measurements and photos catch what the scale can't.
What do 22%, 27%, and 32% body fat look like on a woman?
Numbers only help if you can picture them. These are standardized, photorealistic AI renders from our body fat visualizer — same build, pose, and lighting, so body fat level is the only thing changing between images.
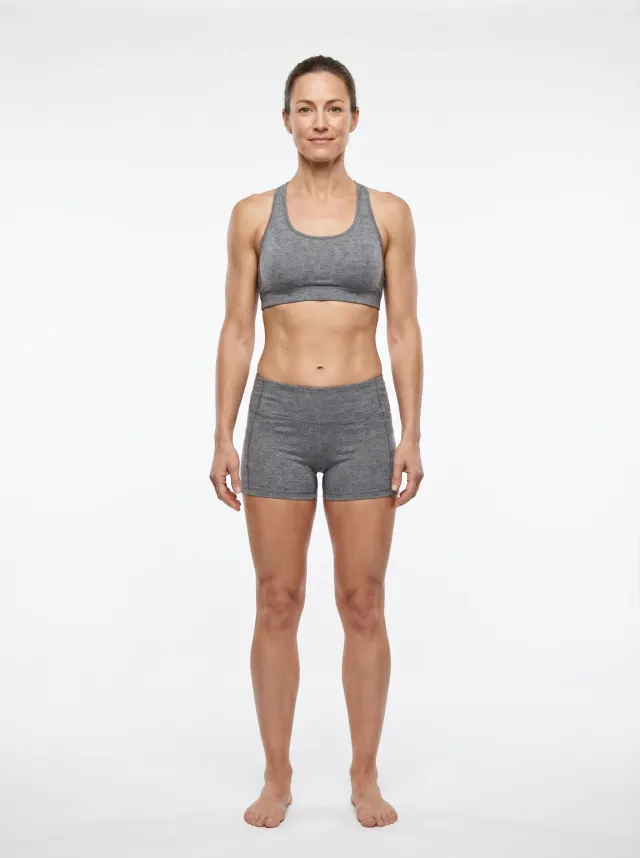
22% — the fitness range. Flat stomach, visible arm and leg definition, curves retained. This is what "toned" measures as, and holding it takes consistent training rather than heroics.
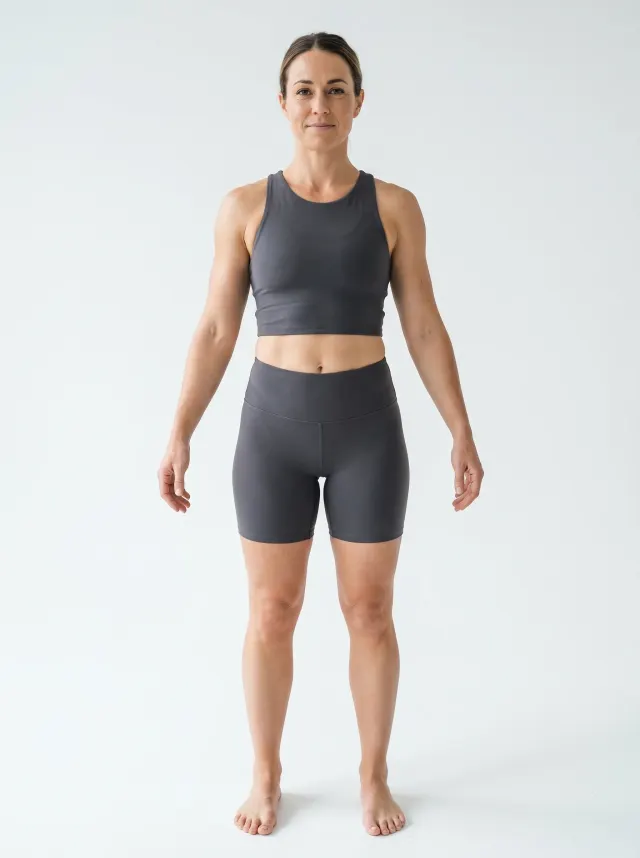
27% — the middle of the chart's average band, and still leaner than commonly cited survey averages. Softness at the midsection, fat carried mostly at the hips and thighs, little visible definition.
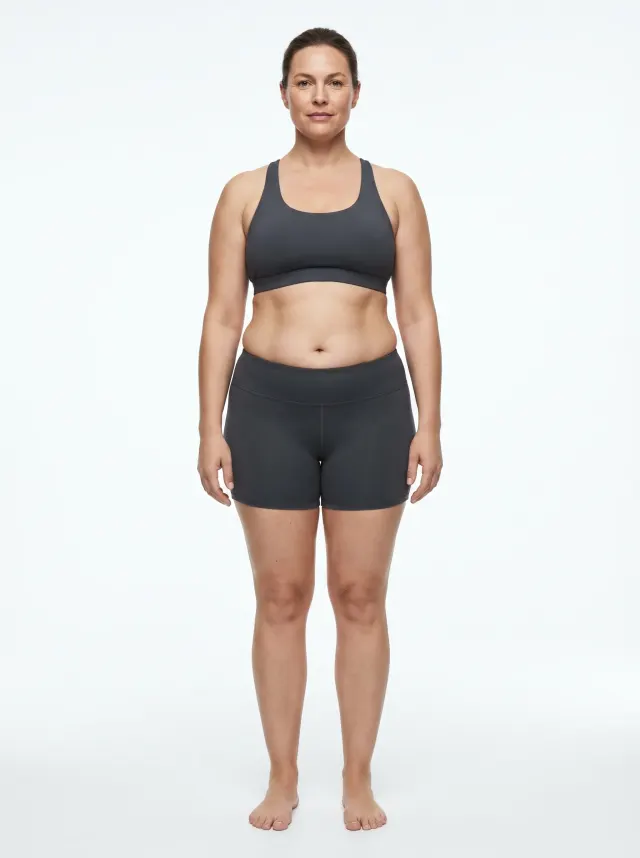
32% — the top of the average band and the threshold charts commonly flag. Close to what many American women measure; the honest read is common and worth addressing, at a sane pace.
Worth noticing: the jump from 22 to 27 changes definition more than size, while the jump from 27 to 32 changes size more than shape. Five points means something different depending on where you start.
For a single-level breakdown, the body fat picture gallery has dedicated pages for 25% and 30% body fat on a woman — the band most of these averages fall in.
What does "toned" actually mean in numbers?
Toned is the fitness band — roughly 21 to 24 percent — with enough muscle underneath to give the leanness a shape. Both halves matter. Dieting from 30 to 23 percent without training reveals whatever muscle exists, and for most untrained women that's a smaller, softer version of the same silhouette. The look women usually mean by toned comes from losing some fat while building some muscle.
That combination is body recomposition, and women — especially women new to lifting — respond well to it. The playbook lives in our body recomposition guide for women: strength training, adequate protein, and a modest or even absent deficit, judged over months.
The measurement problem is the same one this whole page circles: recomp is invisible to a scale, and body fat percentage is the number that actually moves. GainFrame estimates body fat percentage from progress photos, along with muscle-group ratings and a physique score, so the fat-down-muscle-up story shows up in one place over time. Estimates from photos rather than clinical measurement, and iOS only — but consistent week to week, which is what trend-tracking needs. For a one-off number today, the free browser body fat estimator runs a single scan a day with no download or signup.
Frequently asked questions
What is the average body fat percentage for a woman?
Commonly cited survey data puts the average American woman somewhere around 32 to 38 percent body fat, climbing by decade — roughly 32 to 35 percent in the 20s and closer to 40 percent past 50. That sits above the 25 to 31 percent band that category charts label average, which says more about the population than about the chart.
What is a healthy body fat percentage for women?
Commonly cited category charts put the fitness range at 21 to 24 percent and the athletic range at 14 to 20 percent, with 25 to 31 percent as acceptable and elevated risk flagged past 32 percent. Essential fat for women is roughly 10 to 13 percent, and dropping near it disrupts hormones. Where you feel and perform best within that span is individual.
Is 30% body fat bad for a woman?
No — 30 percent sits inside the 25 to 31 percent band that category charts call average, and it is close to what many women actually measure. Fat at that level sits mostly in the hips, thighs, and buttocks with a soft midsection. Health risk climbs more clearly past 32 percent, especially once fat starts accumulating around the stomach.
Why do women naturally have higher body fat than men?
Essential fat — the minimum needed for basic function — is commonly cited at roughly 10 to 13 percent for women versus 2 to 5 percent for men, largely because of reproductive and hormonal biology. Estrogen also directs storage toward the hips and thighs. A woman at 24 percent and a man at 15 percent are at comparable leanness relative to their sex.
Does menopause increase body fat percentage?
Commonly, yes — declining estrogen shifts fat storage toward the midsection and makes holding muscle harder, so body fat percentage tends to drift up through the transition even at a stable weight. The drift is a tilt rather than a verdict: women who strength train through menopause typically show far smaller changes. Tracking composition matters more than tracking scale weight here.
Track your number, on women's math
GainFrame estimates body fat percentage, muscle ratings, and a physique score from your progress photos — so you can see where you sit against the women's ranges and watch the trend move. Free to start on iOS.
Download GainFrame Free