
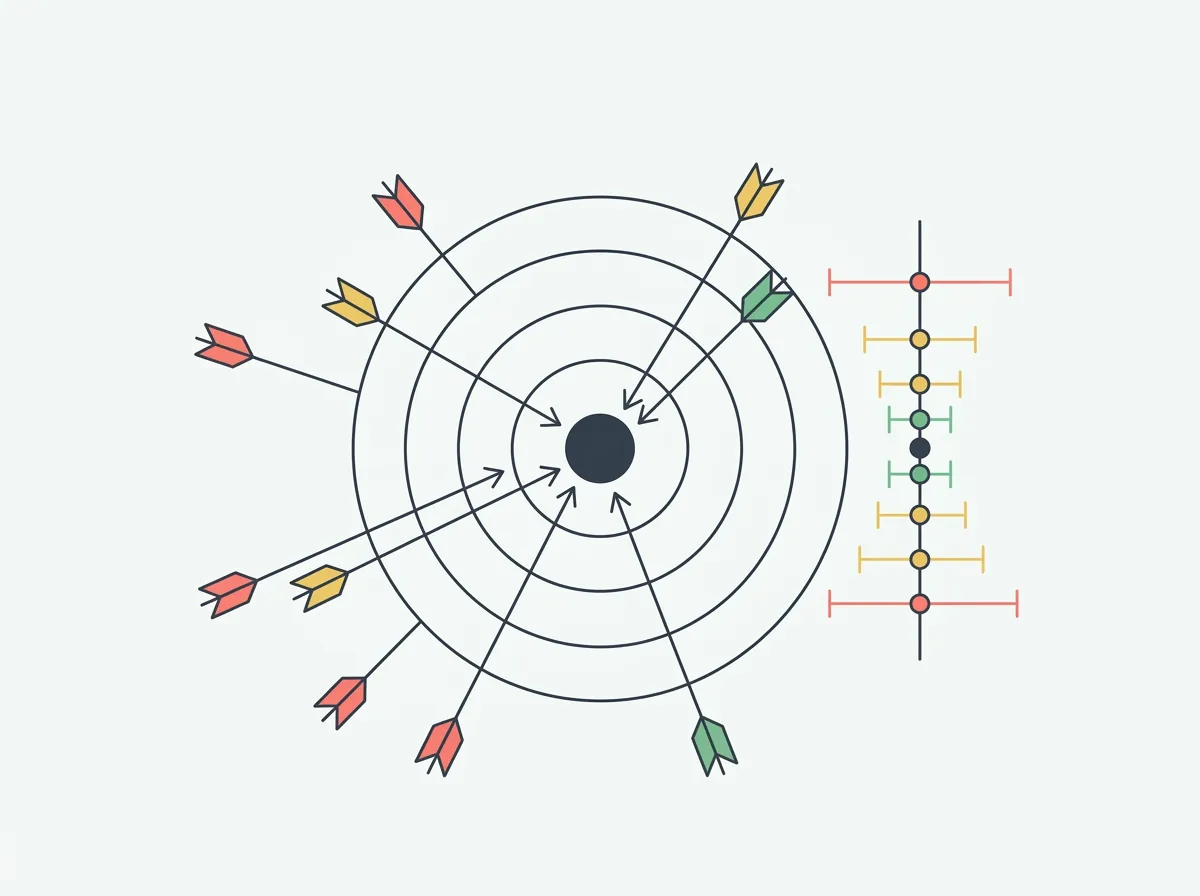
Quick answer: Body fat calculators are estimates with real error bars - commonly cited ranges run roughly ±3-4 points for a well-taken Navy tape measurement and wider for BMI-based formulas. No consumer method is precise enough to chase a single number. Pick one, keep your conditions identical, and trust the direction it moves.
You ran three body fat calculators in one afternoon. The Navy tape one said 17%. The BMI-based one on the same site said 23%. The caliper chart your gym gave you said 20%. Nothing about your body changed between them.
That six-point spread is not a sign that two of the calculators are broken. It's the honest state of consumer body fat estimation: every method models fat from something it can actually measure, and each model was built on a different population with a different set of assumptions. This page walks through each method's real accuracy, then makes the case that precision was never the useful part.
Two companion pages cover adjacent ground: are smart scales accurate goes deep on the BIA number specifically, and every way to measure body fat ranks the full field including lab methods. This one is about the calculators - the formula-based and photo-based estimators you can run for free.
What does a body fat calculator actually calculate?
None of them measure fat. That's the sentence to internalize before any accuracy discussion makes sense.
A body fat calculator takes an input it can measure directly - a circumference, a weight, an electrical resistance, a skinfold thickness, a photograph - and runs it through a regression equation built by measuring a group of people with a lab method and finding the formula that best predicted their results. Your number is that formula's guess about you, based on how closely you resemble the population it was fitted to.
Which means the error has two separate sources. Measurement error, from how carefully you took the input. And model error, from how well you match the reference population. A lifter with a thick neck, a woman post-menopause, and a 22-year-old distance runner can all feed clean measurements into the same formula and get three differently wrong answers.
How accurate is the Navy tape method calculator?
The US Navy method is the strongest free calculator in general use, and it's the one most "body fat calculator" pages are running under the hood. It takes neck and waist circumference for men, plus hips for women, along with height, and returns an estimate through a logarithmic formula.
Under good technique, it is commonly cited as landing within roughly 3 to 4 percentage points of a DEXA reading for people in the middle of the range. That is genuinely useful for a free method involving a $5 tape. You can run the formula with your own measurements in our U.S. Navy tape-measure body fat calculator.
The failure modes are specific and predictable. It reads high on people with thick necks, because the formula treats neck circumference as a lean-mass proxy and a heavily trained neck breaks that assumption. It reads low on people carrying fat mostly on the legs and hips relative to the waist. And it has no way to see visceral versus subcutaneous distribution at all. The full protocol, the actual formulas, and a worked example live in our guide to measuring body fat with a tape measure.
Technique is the larger error source for most people. Tape tension, whether you measured after a normal exhale, and where exactly on the waist you wrapped can each move the result a point or more - which is why the same person taping themselves twice in a row often gets two different answers.
How accurate are BMI-based body fat calculators?
These are the weakest of the group, and it's worth understanding why rather than just being told.
A BMI-based body fat calculator (the Deurenberg-style equations are the common ones) takes your height, weight, age, and sex and estimates body fat from those alone. There is no input anywhere in that list that describes your composition. Two people at the same height, weight, age, and sex get the same answer - a competitive lifter and someone who hasn't trained in a decade.
For population-level screening this is fine, and it's why the approach persists in epidemiology. For an individual who cares enough to search for a body fat calculator, it fails on exactly the people most likely to be running it: anyone muscular reads too high, anyone skinny fat reads too low. Our full breakdown of when BMI is accurate and when it lies covers the fair version of both cases.
The practical rule: if a calculator asks you for nothing but height, weight, age, and sex, it cannot see your body composition - it's estimating an average person of your dimensions. Use it as a rough population reference and nothing more.
How accurate are skinfold caliper calculations?
Calipers pinch subcutaneous fat at three, four, or seven standardized sites and run the sum through a Jackson-Pollock or Durnin-Womersley equation. Commonly cited ranges put a skilled measurement around ±3-5 percentage points against a lab reference.
The word doing the work there is skilled. Caliper accuracy is more technique-dependent than any other consumer method: the exact site, the depth of the pinch, whether you're capturing only skin and fat or catching muscle, how long you wait before reading, and whether the same person takes every measurement. Two testers on the same body routinely differ by several points, and self-measurement on your own back or triceps is close to impossible to do consistently.
There's also a structural limit. Calipers measure subcutaneous fat and infer total body fat from it. Anyone whose fat distribution skews visceral - common as men age - gets an estimate that's optimistic by design.
Where calipers win: with the same tester, same sites, same order, every time, the repeatability is excellent. That makes them a strong tracking tool even when the absolute number is off.
How accurate are photo and AI body fat estimators?
This is the newest category, and it's the one where the honest framing matters most.
Photo-based estimators infer body fat from visual features - waist-to-shoulder relationships, abdominal definition, the visible boundary between muscle and fat. Published work has looked at this seriously: a study in npj Digital Medicine tested AI photo-based estimates against DEXA across 1,273 adults and reported very strong agreement, outperforming the smart scales and calipers in the same comparison. We covered the full study and its limits separately.
Two caveats belong right next to that result. Agreement in a controlled study is not proof that any particular consumer app performs the same way on your photos, in your bathroom lighting, at whatever angle you happened to shoot. And the study tested a specific method under specific conditions, which is a narrower claim than "AI body fat is accurate."
What the photo approach genuinely does better than formulas: it responds to your actual shape rather than to a proxy. A neck circumference is a stand-in for lean mass; a photograph of your torso is the thing itself. That's why photo estimates hold up better on people who break formula assumptions - muscular builds, unusual fat distribution, bodies that don't match the reference population.
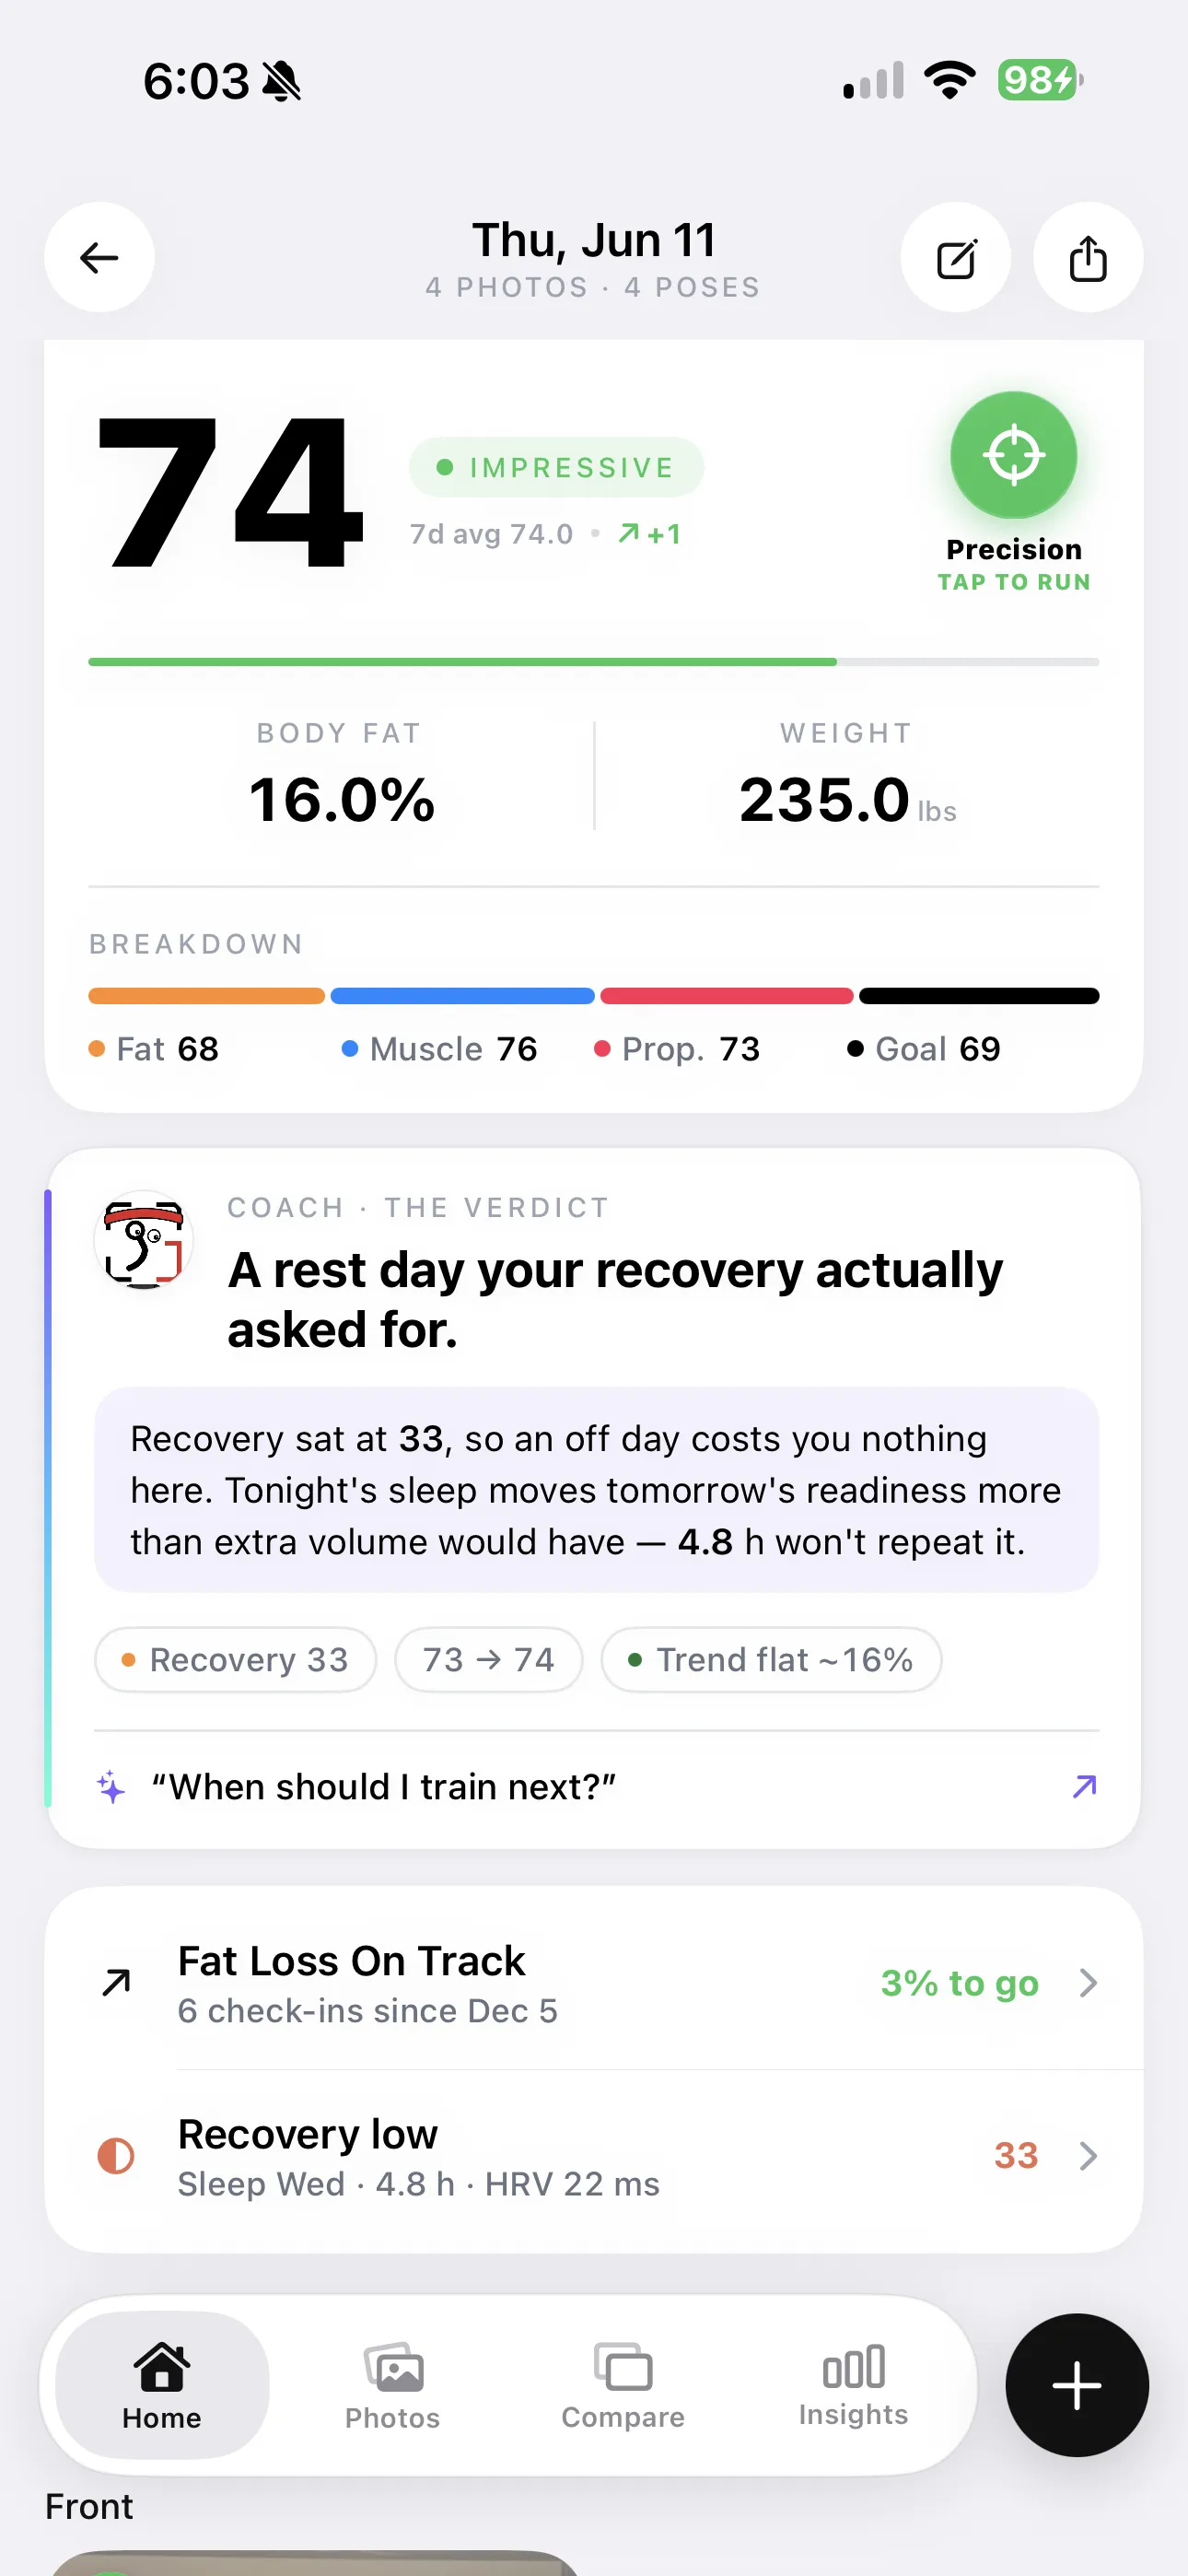
A photo-based estimate returns a percentage alongside FFMI and a physique score - still an estimate, but responding to shape rather than to a proxy.
If you want to try the approach without installing anything, our free browser body fat estimator runs one photo a day and returns an estimate with the same honest caveat: it's a visual estimate, not a measurement.
How accurate are BIA smart scale readings?
Bioelectrical impedance sends a small current through your body and models fat from the resistance it meets. Commonly cited error ranges against DEXA run roughly ±4-8 percentage points, which is the widest band of any method here that involves hardware.
The reason is hydration. Lean tissue conducts well because it holds water; fat conducts poorly. The model's biggest single input is therefore your water content, which swings with salt, sleep, training, and time of day. That's how the same scale can read 21% and 24% on the same person in the same 48 hours without a gram of fat changing hands.
Foot-to-foot scales - the $20-35 tier - also send the current up one leg and down the other, which means your upper body is largely inferred rather than measured. Adding hand electrodes improves this meaningfully, which is the case for stepping up in price. Our smart scale accuracy breakdown covers which numbers on the readout are worth reading at all.
How does DEXA compare as a reference?
DEXA is the practical reference standard for consumer purposes, commonly cited around ±1-2 percentage points, with fat mass, lean mass, and bone density broken out by region. It costs roughly $100-200 per scan.
Two things worth knowing before you treat it as truth. Even DEXA has variation between machines and between software versions, so a scan at one facility isn't perfectly comparable to a scan at another. And at $150 a session, nobody uses it frequently enough to track a training block - which is the entire reason the calculator category exists. Our DEXA alternatives guide covers what to do between scans.
Which method should you actually pick?
Here's the whole field on the two axes that matter - how close a single reading gets, and how reliably it repeats.
| Method | Commonly cited error | Repeatability | Cost | Good for |
|---|---|---|---|---|
| DEXA | ±1-2 pts | High | $100-200/scan | Occasional anchor |
| Navy tape | ±3-4 pts | Medium-high | ~$5 tape | Free trend tracking |
| Calipers | ±3-5 pts | High with one tester | ~$10 | Coached tracking |
| AI photo estimate | Strong DEXA agreement reported in one study | Medium-high with fixed setup | Free-$10/mo | Frequent visual tracking |
| BIA smart scale | ±4-8 pts | Low day to day | $20-400 | Long-run trend only |
| BMI-based formula | Widest; no composition input | High (and consistently wrong) | Free | Population reference |
Notice that repeatability and accuracy come apart. Calipers repeat beautifully and can still be four points off. A BMI formula repeats perfectly and is wrong the same amount every time. That second column is the one that determines whether a method can track a cut, and it's the column almost nobody looks at.
Why is precision the wrong goal here?
Every method on that table has error bars. So the honest question isn't "which calculator tells me my true body fat percentage" - none of them do, reliably, for an individual.
The useful question is whether your number is moving, and in which direction. And a method with a consistent bias handles that question perfectly. If your calculator reads three points high every single time, the change it reports is still accurate. You lose two points on the readout, you lost about two points in reality, regardless of where the baseline sat.
That's what makes consistency the property worth optimizing:
- Pick one method and stop switching. Every switch resets your baseline and injects a step change that isn't real.
- Freeze the conditions. Same time of day, same hydration state, same clothing, same tape landmarks or same camera position and lighting.
- Read four-week windows, not single readings. Body fat changes by tenths of a point per week; anything faster than that on your readout is noise.
- Add a second, independent signal. A weekly waist measurement is the cheapest cross-check there is, and it fails differently than any percentage estimator.
- Anchor occasionally if the absolute number matters. One DEXA every six months calibrates whatever you use in between.
The reframe: a number that's consistently three points off but collected 52 times a year tells you far more about your progress than a perfect number collected twice. Chase the trend line, and let the absolute value be approximately right.
Frequently asked questions
How accurate are body fat calculators?
It depends entirely on which inputs the calculator uses. A Navy tape calculator with clean measurements is commonly cited at roughly ±3-4 percentage points against DEXA. A BMI-based estimator is looser still because it has no measurement of your shape at all. Every consumer method carries error bars wide enough that a single reading shouldn't drive a decision.
Which body fat calculator is the most accurate?
Among free calculators, the Navy tape method generally outperforms BMI-based formulas because it uses circumferences that actually respond to fat loss. Photo-based AI estimators have reported strong agreement with DEXA in published work. Calipers can beat both in trained hands and lose to both in untrained hands. Technique matters more than the formula you pick.
Why do two body fat calculators give me different numbers?
Because they're modeling different things. A tape calculator infers fat from circumference ratios, a scale infers it from electrical resistance, a caliper calculator infers it from skinfold thickness, and each was validated on a different population. Spreads of five or more points across methods are ordinary. Comparing them is comparing four different models, not four readings of one truth.
Is a body fat calculator good enough to track a cut?
Yes, if you use it as a direction meter. Absolute accuracy barely matters when the question is whether the number is falling week over week. Take the reading under identical conditions - same time, same hydration state, same technique - and read a four-week trend rather than any single result. Pair it with a waist measurement for a second opinion.
Do you need a DEXA scan to know your real body fat percentage?
Only if the absolute number has a purpose - a medical question, a competition class, a research baseline. DEXA is commonly cited around ±1-2 percentage points and costs roughly $100-200 per scan, so it works as an occasional anchor rather than a tracking tool. For everything else, a consistent free method plus a trend line answers the same question.
Track the direction, not the decimal
GainFrame estimates body fat, FFMI, and 12 muscle-group ratings from a single progress photo, then plots every check-in on one timeline so you can read the trend instead of arguing with a number. On-device, no account, free to start on iOS.
Download GainFrame Free